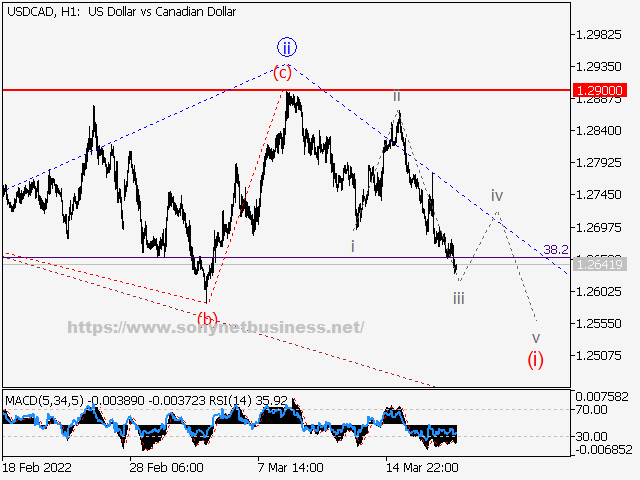
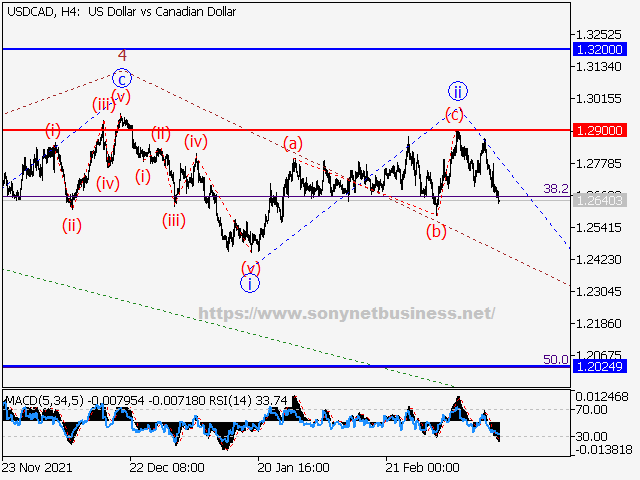
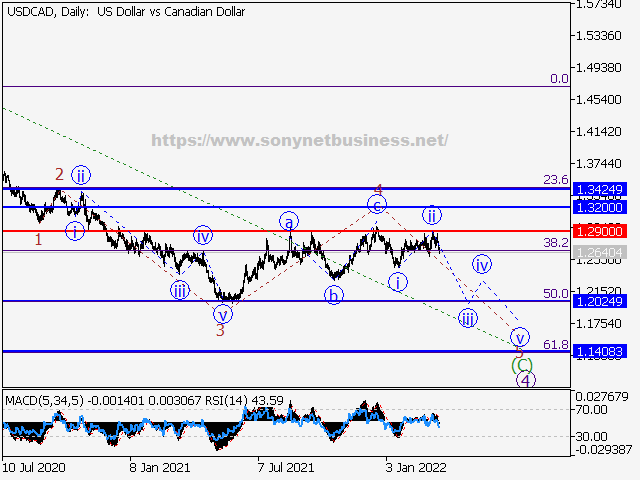
Short positions from corrections below 1.2900 with a target of 1.2024 – 1.1408 are the main scenario.
Alternative scenario: The pair will continue to rise to levels of 1.3200 – 1.3424 if it breaks out and consolidates above the level of 1.2900.
On the daily chart, a descending correction looks to be continuing as the fourth wave 4 of larger degree, with wave (C) forming inside. On the H4 chart, an ascending corrective has completed as wave 4 of (C), and the fifth wave 5 of (C) is forming. On the H1 chart, it appears that local correction ii of 5 has completed and wave iii of 5 has begun to emerge. If the prediction is true, the pair will continue to fall to 1.2024 – 1.1408 levels. In this scenario, the level of 1.2900 is crucial, as a breakout will allow the pair to continue advancing to levels of 1.3200 – 1.3424.
 |
| USDCAD Elliott Wave Analysis and Forecast for the Week of March 18th to March 25th |
 |
| USDCAD Elliott Wave Analysis and Forecast for the Week of March 18th to March 25th |
 |
| USDCAD Elliott Wave Analysis and Forecast for the Week of March 18th to March 25th |


.png)
.png)