


Candlestick Pattern E-Book :

Forex trading is a dynamic and complex world, with traders constantly seeking insights to make profitable decisions. One of the most valuable tools in a trader's arsenal is the analysis of candlestick patterns. These patterns, formed by the open, high, low, and close prices of a currency pair during a specific time period, provide crucial information about market sentiment and potential price movements. In this comprehensive guide, we will delve into the world of Forex candlestick patterns, helping you decipher the language of the market.
What Are Candlestick Patterns?
Candlestick patterns are visual representations of price movements in the Forex market. They are named after their candle-like appearance, with a "candle" representing a specific time frame, such as 1 minute, 1 hour, or 1 day. Each candlestick has two main components: the body and the wicks (or shadows). The body represents the difference between the open and close prices during the specified time period, while the wicks indicate the high and low prices.
Why Candlestick Patterns Matter:
Candlestick patterns are valuable because they provide insights into market sentiment and potential reversals or continuations in price trends. Traders use these patterns to make informed decisions about when to enter or exit trades. Here are some key points to consider:
1. Basic Candlestick Patterns:
Doji: Indicates market indecision with equal open and close prices.
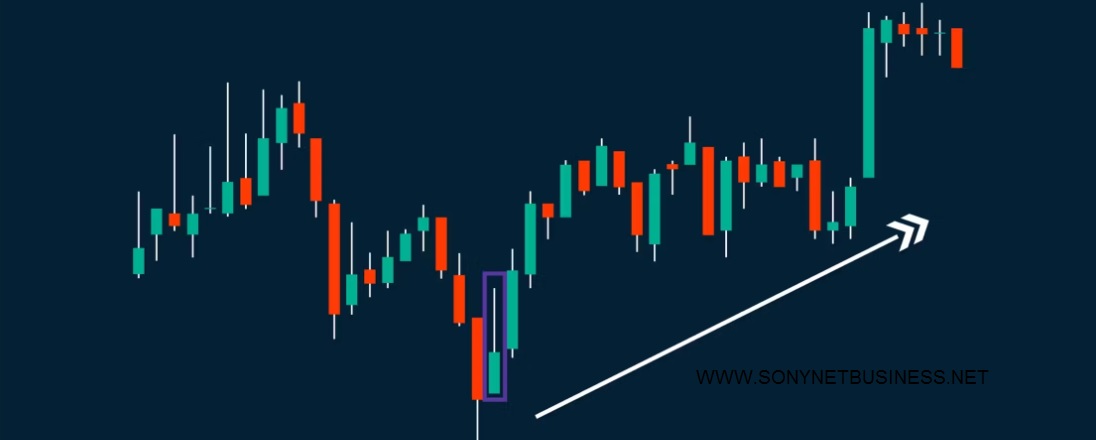
Hammer and Hanging Man: Suggest potential reversals, with long lower wicks and small bodies.
Engulfing Patterns: Signal potential trend reversals when a larger candle engulfs the previous one.
2. Continuation Patterns:
Bullish and Bearish Flags: Suggest temporary pauses in trends before continuing.
Pennants: Indicate short-term consolidation before price movements resume.
Triangles: Form during price consolidation and often lead to breakouts.
3. Reversal Patterns:
Head and Shoulders: Signals a potential trend reversal with three peaks resembling shoulders and a head.
Double and Triple Tops and Bottoms: Indicate trend reversal points.
Evening and Morning Stars: Suggest potential reversals after uptrends or downtrends.
4. Using Candlestick Patterns in Trading:
Confirm signals with other technical analysis tools, such as support and resistance levels, moving averages, and trendlines.
Consider the time frame you're trading on; patterns may have different significance on various time frames.
5. Risk Management:
Always implement proper risk management strategies, like setting stop-loss orders, to protect your capital.
Candlestick Pattern E-Book :
Conclusion:
Mastering Forex candlestick patterns takes time and practice. These visual cues offer valuable insights into market dynamics and can significantly enhance your trading decisions. While candlestick patterns are powerful tools, they should be used in conjunction with other forms of analysis to form a well-rounded trading strategy. With dedication and experience, you can develop the skills needed to read and interpret these patterns effectively, increasing your chances of success in the Forex market.


.png "Click Here")
.png "Click Here")