EURUSD Elliott Wave Analysis and Forecast for April 29th to May 6th, 2022
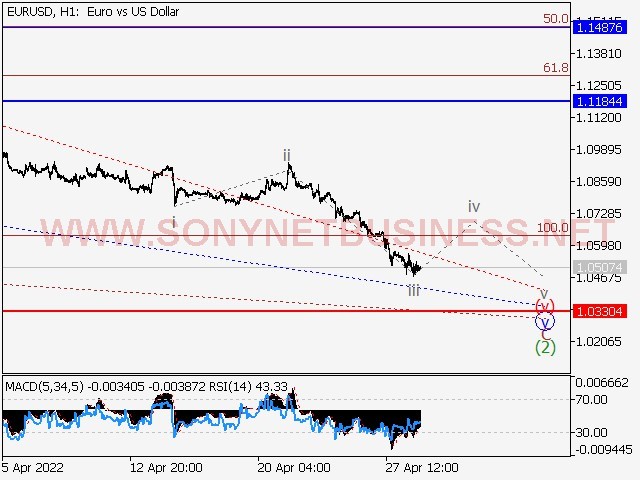
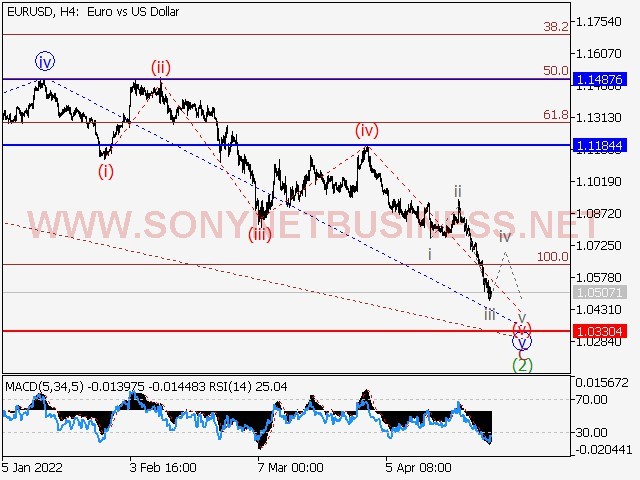
Main scenario: once a correction has formed, consider long positions above the level of 1.0330 with a target of 1.1184 – 1.1487.
Alternative scenario: The pair will continue to fall to levels of 1.0000 – 0.9816 if it breaks and consolidates below the level of 1.0330.
On the daily chart, a downward corrective appears to be developing as the second wave of greater magnitude (2). On the H4 chart, Wave C of (2) appears to be forming, with the fifth wave v of (2) nearing completion inside. The fifth wave of smaller degree (v) of v is building on the H1 chart, with wave iii of (v) likely finished as part of it. If the assumption is right, the pair might rise to levels between 1.1184 and 1.1487 once wave v of C of (2) is completed. In this circumstance, the level of 1.0330 is crucial. Its breakout will lead the pair to fall to levels between 1.0000 and 0.9816.
 |
| EURUSD Elliott Wave Analysis and Forecast for April 29th to May 6th, 2022 |
 |
| EURUSD Elliott Wave Analysis and Forecast for April 29th to May 6th, 2022 |
 |
| EURUSD Elliott Wave Analysis and Forecast for April 29th to May 6th, 2022 |
GBPUSD Elliott Wave Analysis and Forecast for April 29th to May 6th, 2022
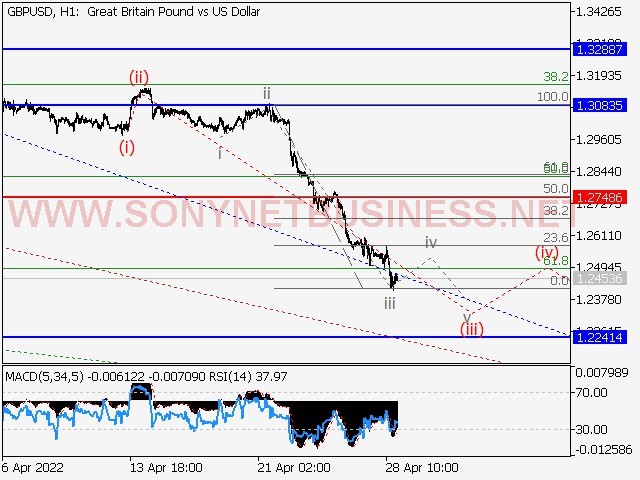
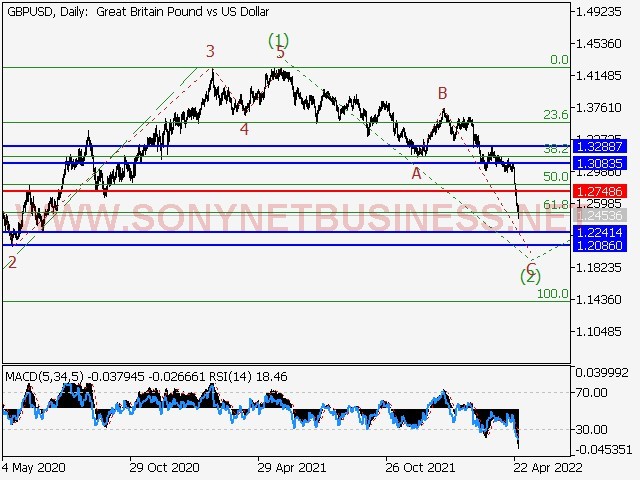
Short positions from corrections below 1.2748 with a target of 1.2241 – 1.2086 are the main scenario.
Alternative scenario: The pair will continue to rise to levels of 1.3083 – 1.3288 if it breaks out and consolidates above the level of 1.2748.
On the daily chart, the first wave of larger degree (1) has developed, and a descending corrective is developing as wave 2. (2). Wave C of (2) is forming on the H4 chart, with wave v of C forming as a part of it. On the H1 chart, it appears that the third wave of smaller degree (iii) of v is developing, with wave iii of (iii) forming inside. If the prediction is true, the pair will continue to fall to levels between 1.2241 and 1.2086 after correction iv of the RSI (iii). In this scenario, the level of 1.2748 is key, as a breakout will allow the pair to continue advancing to levels of 1.3083 – 1.3288.
 |
| GBPUSD Elliott Wave Analysis and Forecast for April 29th to May 6th, 2022 |
 |
| GBPUSD Elliott Wave Analysis and Forecast for April 29th to May 6th, 2022 |
 |
| GBPUSD Elliott Wave Analysis and Forecast for April 29th to May 6th, 2022 |
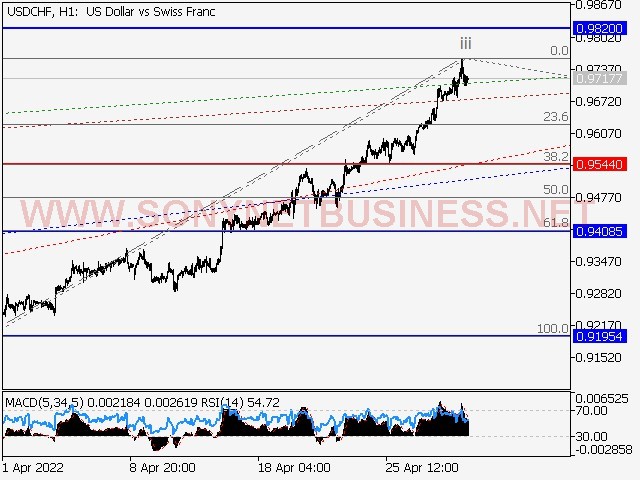
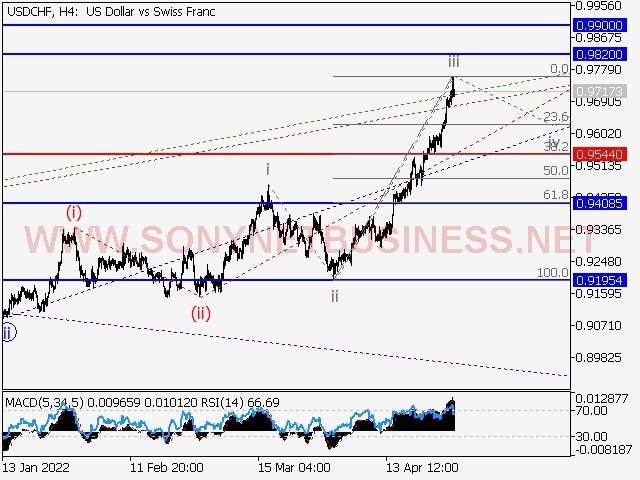
USDCHF Elliott Wave Analysis and Forecast for April 29th to May 6th, 2022
Long positions from corrections above 0.9544 with a target of 0.9820 – 0.9900 are the main scenario.
Alternative scenario: The pair will continue to fall to levels of 0.9408 – 0.9195 if it breaks and consolidates below the level of 0.9544.
On the daily chart, a downward first wave of bigger degree (1) of 5 has developed, and a bullish corrective as the second wave (2) of 5 is still developing, with wave C of (2) forming as part of it. On the H4 chart, the third wave iii of C is forming, with wave (iii) of iii forming inside. On the H1 chart, the third wave of smaller degree iii of (iii) appears to be forming. If this assumption is valid, once a local correction iv of (iii) is created, the pair will continue to increase to 0.9820 – 0.9900. In this circumstance, the level of 0.9544 is critical. The pair will be able to continue sliding to levels of 0.9408 – 0.9195 as a result of its breakthrough.
 |
| USDCHF Elliott Wave Analysis and Forecast for April 29th to May 6th, 2022 |
 |
| USDCHF Elliott Wave Analysis and Forecast for April 29th to May 6th, 2022 |
 |
| USDCHF Elliott Wave Analysis and Forecast for April 29th to May 6th, 2022 |
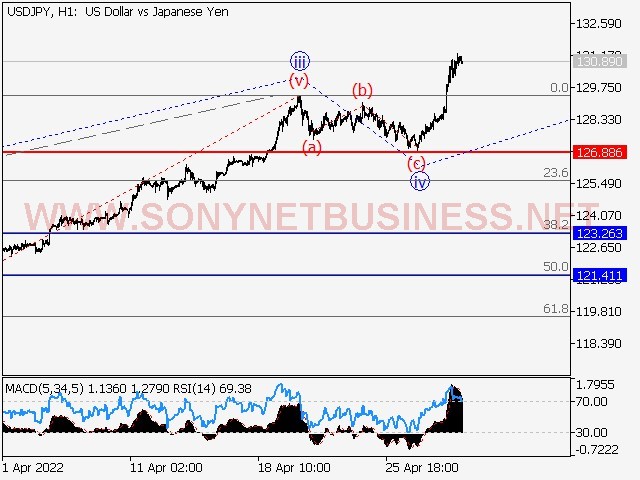
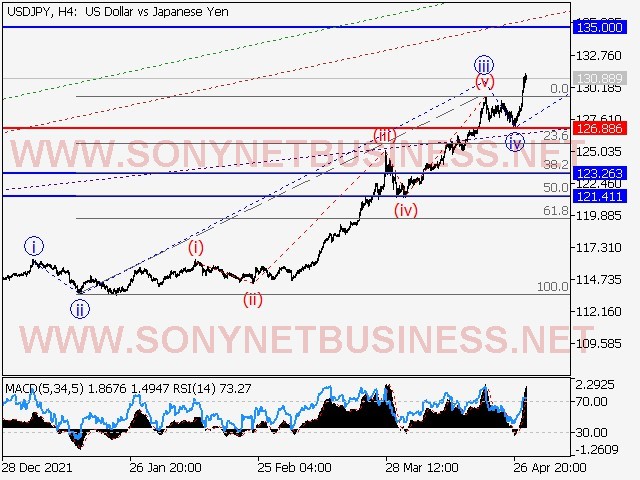
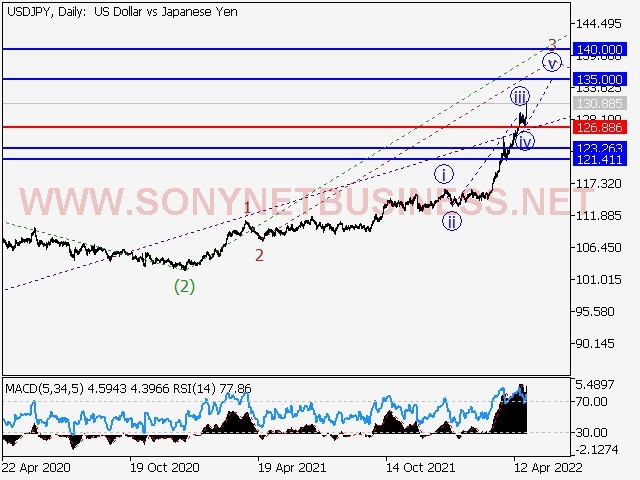
USDJPY Elliott Wave Analysis and Forecast for April 29th to May 6th, 2022
The main scenario is to take long positions on corrections above 126.88, with a target of 135.00–140.00.
Alternative scenario: The pair will continue to fall to levels of 123.26 – 121.41 if it breaks and consolidates below the level of 126.88.
On the daily chart, the third wave of bigger degree (3) is still developing, with wave 3 of (3) forming inside. The third wave of smaller degree iii of 3 appears to have finished developing on the H4 chart, and a corrective wave iv of 3 appears to have finished developing. On the H1 chart, the fifth wave v of 3 appears to be forming. The pair will continue to increase to 135.00 – 140.00 if this assumption is right. In this situation, the level of 126.88 is crucial because if it is broken, the pair will continue to fall to the levels of 123.26 – 121.41.
 |
| USDJPY Elliott Wave Analysis and Forecast for April 29th to May 6th, 2022 |
 |
| USDJPY Elliott Wave Analysis and Forecast for April 29th to May 6th, 2022 |
 |
| USDJPY Elliott Wave Analysis and Forecast for April 29th to May 6th, 2022 |
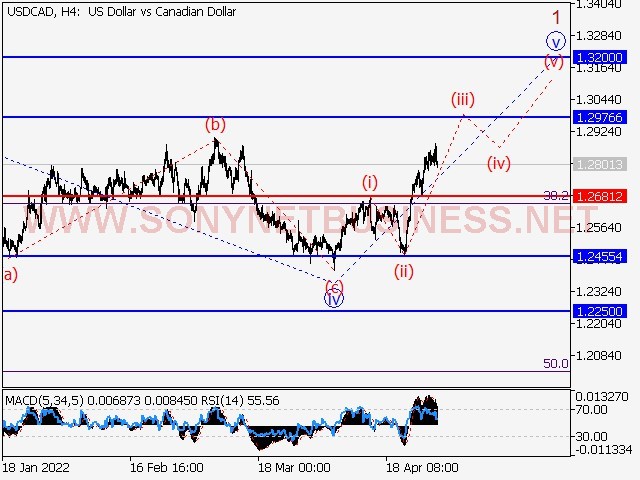
USDCAD Elliott Wave Analysis and Forecast for April 29th to May 6th, 2022
Long positions from corrections over 1.2681 with a goal of 1.2976 – 1.3200 are the main scenario.
Alternative scenario: The pair will continue to fall to levels of 1.2455 – 1.2250 if it breaks and consolidates below the level of 1.2681.
On the daily chart, a downward correction as the fourth wave 4 of bigger degree has purportedly ended, and the fifth wave 5 has begun to form, with wave 1 of (1) of 5 developing inside.On the H4 chart, a corrective wave iv of 1 ended forming, and wave v of 1 began to form. On the H1 chart, it appears that the first wave of smaller degree I of v has developed, as well as a local correction (ii) of v, and wave (ii) of v is developing. If the prediction is true, the pair will increase to levels between 1.2976 and 1.3200. In this situation, the level of 1.2681 is significant because if it is broken, the pair will continue to fall to the levels of 1.2455 – 1.2250.
 |
| USDCAD Elliott Wave Analysis and Forecast for April 29th to May 6th, 2022 |
 |
| USDCAD Elliott Wave Analysis and Forecast for April 29th to May 6th, 2022 |
 |
| USDCAD Elliott Wave Analysis and Forecast for April 29th to May 6th, 2022 |
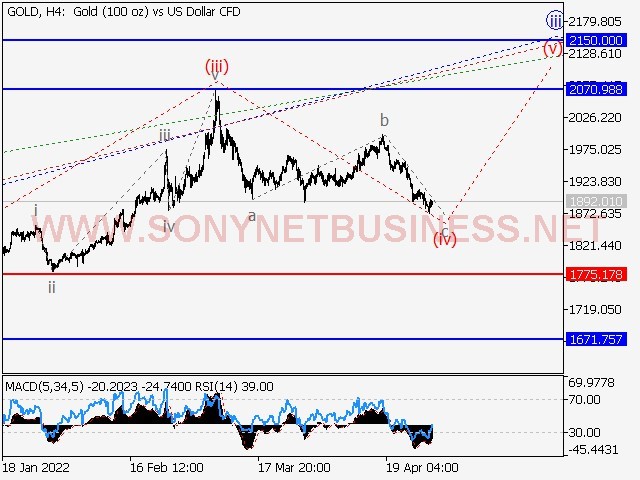
XAUUSD Elliott Wave Analysis and Forecast for April 29th to May 6th, 2022
Long positions above 1775.17 with a goal of 2070.98 – 2150.00 after correction are the main scenario.
Alternative scenario: The pair will continue to fall to levels of 1671.75 – 1600.00 if it breaks and consolidates below the level of 1775.17.
On the daily chart, the fifth wave of larger degree (5) is still developing, with wave 3 of (5) forming inside. On the H4 chart, wave iii of 3 appears to be forming, with a local correction as the fourth wave (iv) of iii inside. On the H1 chart, wave c of (iv) of iii is forming. If this assumption is right, the pair will continue to rise until it reaches 2070.98 – 2150.00 once wave (iv) of iii is completed. In this situation, the level of 1775.17 is significant because if it is broken, the pair will continue to fall to the levels of 1671.75 – 1600.00.
 |
| XAUUSD Elliott Wave Analysis and Forecast for April 29th to May 6th, 2022 |
 |
| XAUUSD Elliott Wave Analysis and Forecast for April 29th to May 6th, 2022 |
 |
| XAUUSD Elliott Wave Analysis and Forecast for April 29th to May 6th, 2022 |
The Analytical Materials are Provided by, SONY Net Business A Trader and Analyst.


.png)
.png)