EURUSD Elliott Wave Analysis and Forecast for May 13th to May 20th, 2022
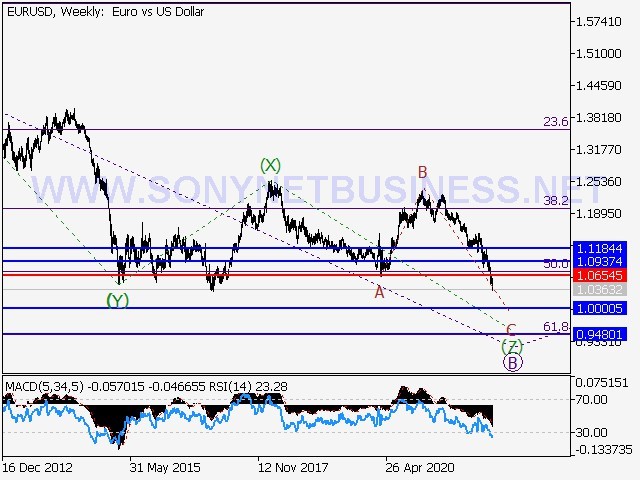
Short positions from corrections below 1.0654 with a goal of 1.0000 – 0.9480 are the main scenario.
Alternative scenario: The pair will continue to rise to levels of 1.0937 – 1.1184 if it breaks out and consolidates above the level of 1.0654.
On the weekly chart, a bearish correction appears to be emerging as wave of larger degree B, which is forming as a triple zigzag (W)-(X)-(Y)-(X)-(X)-(X)-(X)-(X)-(X)-(X (Z). On the daily chart, wave (Z) of B appears to be unfolding, with wave C of (Z) developing as part of it. On the H4 chart, the fifth wave of smaller degree v of C is forming, with wave (iii) of v forming as part of it. If the prediction is right, the pair will decline to levels between 1.0000 and 0.9480. In this circumstance, the level of 1.0654 is crucial. Its breakout will help the pair to rise to levels between 1.0937 and 1.1184.
 |
| EURUSD Elliott Wave Analysis and Forecast for May 13th to May 20th, 2022 |
 |
| EURUSD Elliott Wave Analysis and Forecast for May 13th to May 20th, 2022 |
 |
| EURUSD Elliott Wave Analysis and Forecast for May 13th to May 20th, 2022 |
GBPUSD Elliott Wave Analysis and Forecast for May 13th to May 20th, 2022
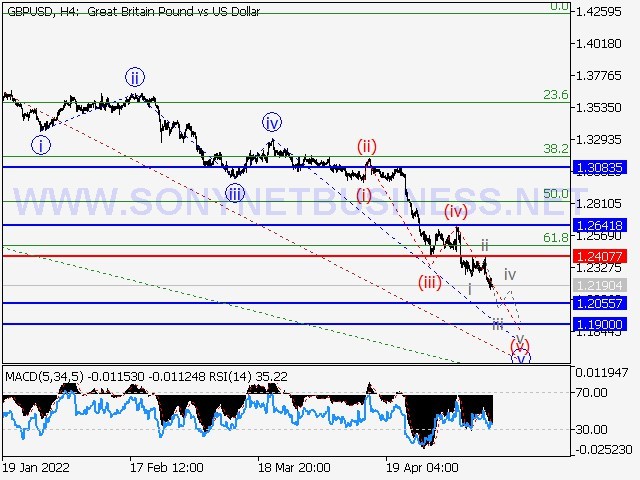
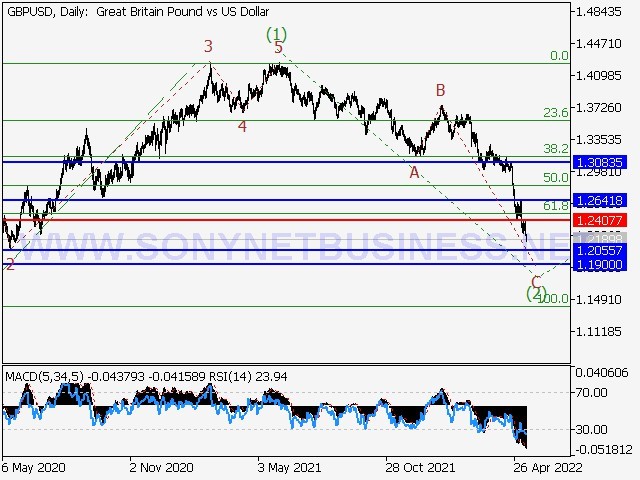
Short positions from corrections below 1.2407 with a target of 1.2055 – 1.1900 are the main scenario.
Alternative scenario: The pair will continue to rise to levels of 1.2641 – 1.3083 if it breaks out and consolidates above the level of 1.2407.
On the daily chart, the first larger wave (1) has formed, and a negative corrective is still developing as wave (2). (2). On the H4 chart, wave C of (2) is forming, with the fifth wave v of C as its component. On the H1 chart, the fourth wave of smaller degree (iv) of v appears to have developed, and wave (v) of v of C is unfolding, with wave iii of (v) forming as part of it. If the forecast is true, the pair will continue to fall to levels between 1.2055 and 1.1900. In this scenario, the level of 1.2407 is key, as a breakout will allow the pair to continue advancing to levels of 1.2641 – 1.3083.
 |
| GBPUSD Elliott Wave Analysis and Forecast for May 13th to May 20th, 2022 |
 |
| GBPUSD Elliott Wave Analysis and Forecast for May 13th to May 20th, 2022 |
 |
| GBPUSD Elliott Wave Analysis and Forecast for May 13th to May 20th, 2022 |
USDCHF Elliott Wave Analysis and Forecast for May 13th to May 20th, 2022
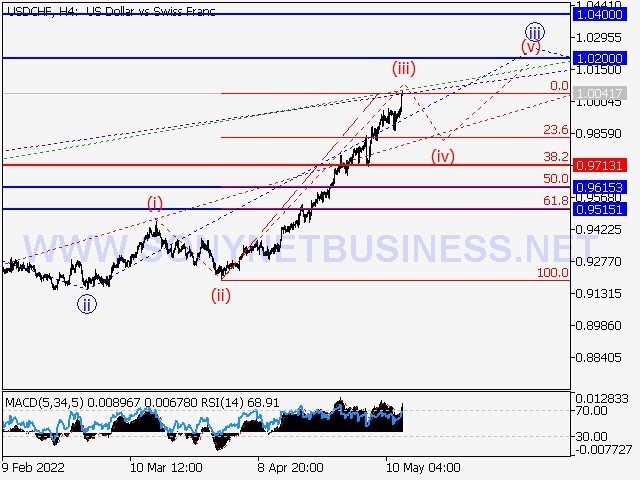
Long positions from corrections above 0.9713 with a target of 1.0200–1.0400 are the main scenario.
Alternative scenario: The pair will continue to fall to levels of 0.9615 – 0.9515 if it breaks and consolidates below the level of 0.9713.
On the daily chart, the third wave of bigger degree (3) is forming, with wave 3 of (3) as a part of it. On the H4 chart, the third wave of smaller degree iii of 3 is supposedly developing, with wave (iii) of iii forming inside. On the H1 chart, a local correction appears to be developing as the fourth wave (iv) of iii. If this assumption is right, and the correction is complete, the pair will continue to rise to levels between 1.0200 and 1.0400. In this case, the level of 0.9713 is critical. The pair will continue to tumble to levels of 0.9615 – 0.9515 if it breaks out.
 |
| USDCHF Elliott Wave Analysis and Forecast for May 13th to May 20th, 2022 |
 |
| USDCHF Elliott Wave Analysis and Forecast for May 13th to May 20th, 2022 |
 |
| USDCHF Elliott Wave Analysis and Forecast for May 13th to May 20th, 2022 |
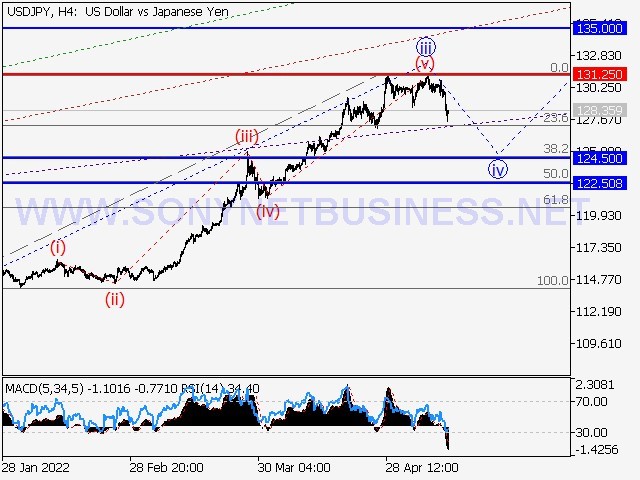
USDJPY Elliott Wave Analysis and Forecast for May 13th to May 20th, 2022
Short positions from corrections below 131.25 with a goal of 124.50 – 122.50 are the main scenario.
Alternative scenario: The pair will continue to rise to levels of 135.00 – 140.00 if it breaks out and consolidates above the level of 131.25.
On the daily chart, the third wave of bigger degree (3) is still developing, with wave 3 of (3) forming inside. The third wave of smaller degree iii of 3 appears to have ended on the H4 chart, and a corrective wave iv of 3 has begun to form. On the H1 chart, wave (a) of iv looks to be unfolding. If the prediction is true, the pair will continue to fall to 124.50–122.50 levels. In this scenario, the level of 131.25 is key, as a breakout will allow the pair to continue advancing to levels of 135.00 – 140.00.
 |
| USDJPY Elliott Wave Analysis and Forecast for May 13th to May 20th, 2022 |
 |
| USDJPY Elliott Wave Analysis and Forecast for May 13th to May 20th, 2022 |
 |
| USDJPY Elliott Wave Analysis and Forecast for May 13th to May 20th, 2022 |
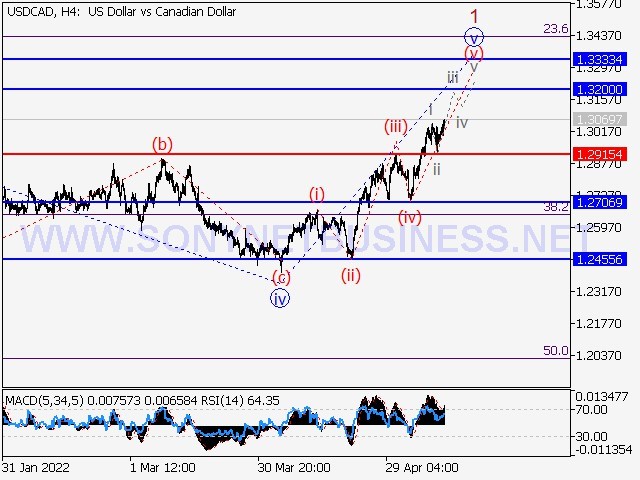
USDCAD Elliott Wave Analysis and Forecast for May 13th to May 20th, 2022
Long positions from corrections over 1.2915 with a target of 1.3200–1.3333 are the main scenario.
Alternative scenario: The pair will continue to fall to levels of 1.2706 – 1.2455 if it breaks and consolidates below the level of 1.2915.
On the daily chart, a downward correction as the fourth wave 4 of bigger degree has purportedly ended, and the fifth wave 5 has begun to form, with wave 1 of (1) of 5 developing inside. A corrective wave iv of 1 has completed on the H4 chart, and wave v of 1 is forming. The third wave of smaller degree (iii) of v appears to be forming on the H1 chart, a local correction has completed as wave (iv) of v, and wave (v) of v is unfolding. If the prediction is right, the pair will increase to levels between 1.3200 and 1.3333.In this situation, the level of 1.2915 is significant because if it is broken, the pair will continue to fall to the levels of 1.2706 – 1.2455.
 |
| USDCAD Elliott Wave Analysis and Forecast for May 13th to May 20th, 2022 |
 |
| USDCAD Elliott Wave Analysis and Forecast for May 13th to May 20th, 2022 |
 |
| USDCAD Elliott Wave Analysis and Forecast for May 13th to May 20th, 2022 |
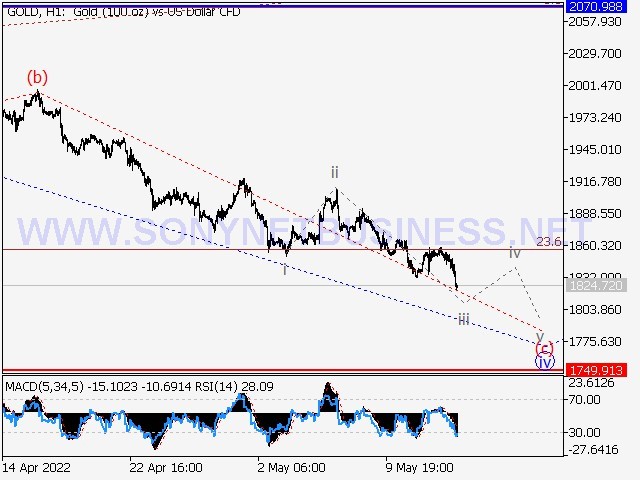
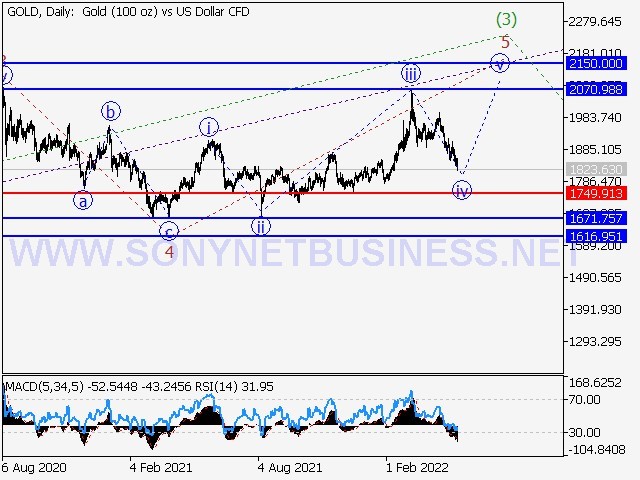
XAUUSD Elliott Wave Analysis and Forecast for May 13th to May 20th, 2022
Long positions above 1749.91 with a goal of 2070.98 – 2150.00 after correction are the main scenario.
Alternative scenario: The pair will continue to fall to levels of 1671.75 – 1616.95 if it breaks and consolidates below the level of 1749.91.
On the daily chart, the third wave of larger degree (3) is still developing, with the fifth wave 5 of (3) forming inside. On the H4 chart, wave iii of 5 appears to be complete, and a local correction is developing as wave iv of 5. On the H1 chart, wave (c) of iv appears to be nearing conclusion. If this assumption is right, the pair will continue to rise to 2070.98 – 2150.00 after the completion of wave (с) of iv. In this situation, the level of 1749.91 is significant because if it is broken, the pair will continue to fall to the levels of 1671.75 – 1616.95.
 |
| XAUUSD Elliott Wave Analysis and Forecast for May 13th to May 20th, 2022 |
 |
| XAUUSD Elliott Wave Analysis and Forecast for May 13th to May 20th, 2022 |
 |
| XAUUSD Elliott Wave Analysis and Forecast for May 13th to May 20th, 2022 |


.png)
.png)