 |
| Forex Elliott wave analysis and forecast for June 10th to June 17th |
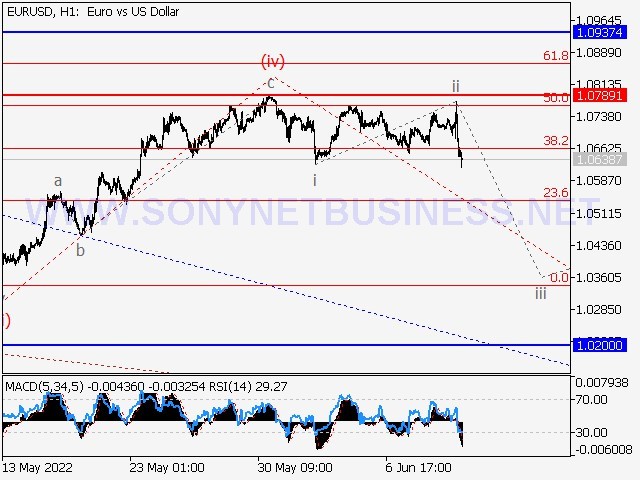
EURUSD Elliott wave analysis and forecast for June 10th to June 17th.
Short positions from corrections below 1.0789 with a goal of 1.0200 – 1.0000 are the main scenario.
Alternative scenario: The pair will continue to rise to levels of 1.0937 – 1.1184 if it breaks out and consolidates above the level of 1.0789.
On the daily chart, a negative correction is likely to continue as wave of larger degree B, with the final wave (Z) of B emerging as part of it. On the H4 chart, Wave C of (Z) looks to be unfolding, with the fifth wave of lesser degree v of C forming inside. Wave (iii) of v has developed on the H1 chart, a local correction has been completed as the fourth wave (iv) of v, and the fifth wave (v) of v has begun to develop. If the prediction is right, the pair will continue to fall to 1.0200 – 1.0000 levels. In this circumstance, the level of 1.0789 is critical. Its breakout will help the pair to rise to levels between 1.0937 and 1.1184.
 |
| EURUSD Elliott wave analysis and forecast for June 10th to June 17th. |
 |
| EURUSD Elliott wave analysis and forecast for June 10th to June 17th. |
 |
| EURUSD Elliott wave analysis and forecast for June 10th to June 17th. |
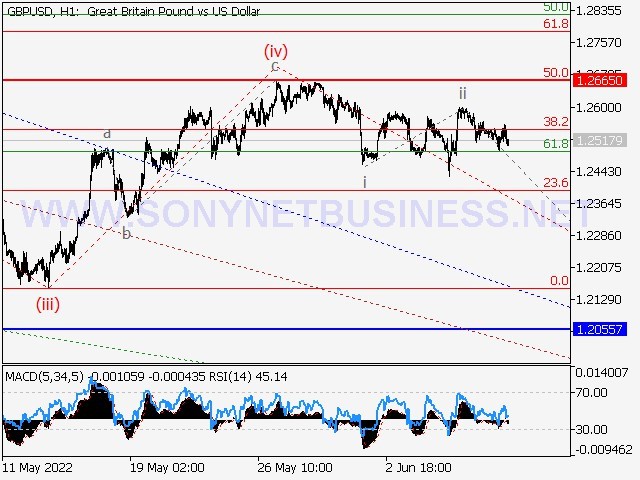
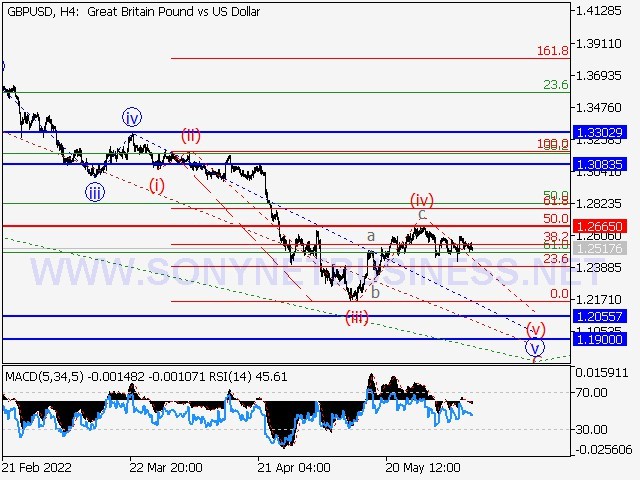
GBPUSD Elliott wave analysis and forecast for June 10th to June 17th.
Short positions from corrections below 1.2665 with a target of 1.2055 – 1.1900 are the main scenario.
Alternative scenario: The pair will continue to rise to levels of 1.3083 – 1.3302 if it breaks out and consolidates above the level of 1.2665.
On the daily chart, the first wave of larger degree (1) has developed, and a downward corrective is developing as wave 2. (2). Wave C of (2) is forming on the H4 chart, with the fifth wave v of C forming as part of it. On the H1 chart, it appears that the third wave of smaller degree (iii) of v emerged, a local correction ended as the fourth wave (iv) of v, and the fifth wave (v) of v began to unfold. If the prediction is true, the pair will continue to fall to 1.2055 – 1.1900 levels. In this scenario, the level of 1.2665 is key, as a breakout will allow the pair to continue advancing to levels of 1.3083 – 1.3302.
 |
| GBPUSD Elliott wave analysis and forecast for June 10th to June 17th. |
 |
| GBPUSD Elliott wave analysis and forecast for June 10th to June 17th. |
 |
| GBPUSD Elliott wave analysis and forecast for June 10th to June 17th. |
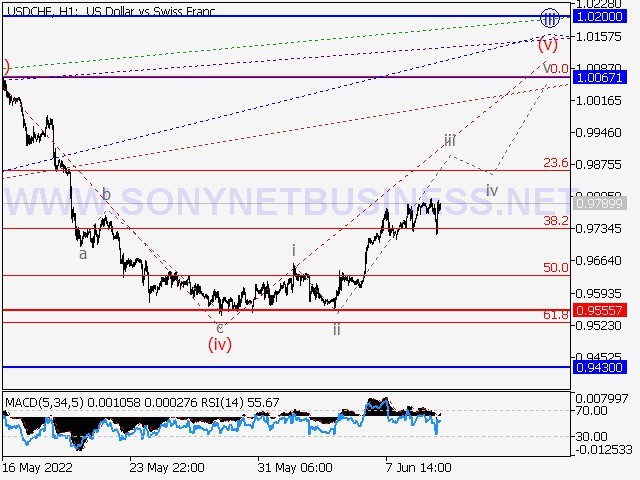
USDCHF Elliott wave analysis and forecast for June 10th to June 17th.
Long positions from corrections over 0.9555 with a goal of 1.0067 – 1.0200 are the main scenario.
Alternative scenario: The pair will continue to fall to levels of 0.9430 – 0.9194 if it breaks out and consolidates below the level of 0.9555.
On the daily chart, the third wave of bigger degree (3) is forming, with wave 3 of (3) forming as part of it. On the H4 chart, the third wave of smaller degree iii of 3 is apparently forming, with wave (iii) forming and a local correction as the fourth wave (iv) of iii inside. On the H1 chart, the fifth wave (v) of iii appears to be forming. The pair will continue to increase to 1.0067 – 1.0200 if this assumption is right. In this circumstance, the level of 0.9555 is critical. Its breakout will cause the pair to tumble to levels between 0.9430 and 0.9194.
 |
| USDCHF Elliott wave analysis and forecast for June 10th to June 17th. |
 |
| USDCHF Elliott wave analysis and forecast for June 10th to June 17th. |
 |
| USDCHF Elliott wave analysis and forecast for June 10th to June 17th. |
USDJPY Elliott wave analysis and forecast for June 10th to June 17th.
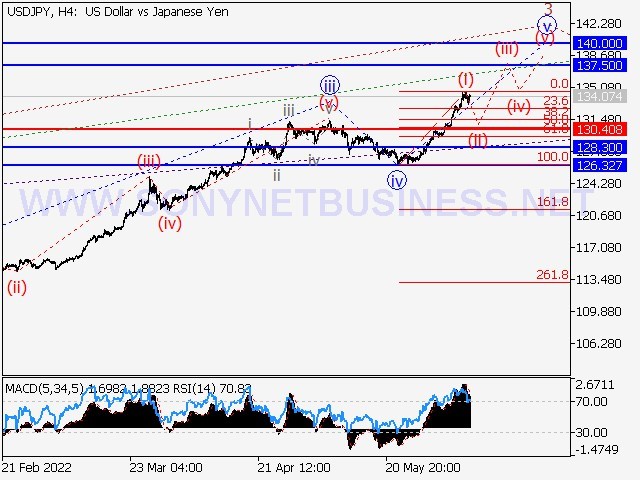
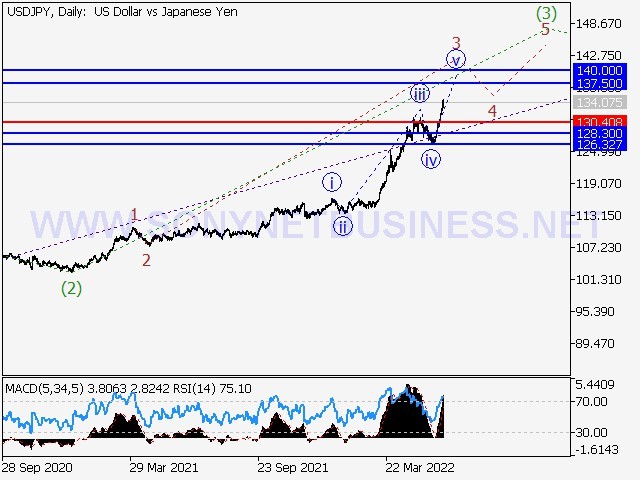
Long positions from corrections over 130.40 with a goal of 137.50 – 140.00 are the main scenario.
Alternative scenario: The pair will continue to fall to levels of 128.30 – 126.32 if it breaks and consolidates below the level of 130.40.
On the daily chart, the third wave of bigger degree (3) is still developing, with wave 3 of (3) forming inside. On the H4 chart, the fourth wave of smaller degree iv of 3 created a downward correction, and the fifth wave v of 3 began to form. On the H1 chart, wave I of v appears to be forming. Once a local correction (ii) of v is over, if this assumption is right, the pair will continue to increase to 137.50 – 140.00. In this situation, the level of 130.40 is crucial because if it is broken, the pair will continue to fall to the levels of 128.30 – 126.32.
 |
| USDJPY Elliott wave analysis and forecast for June 10th to June 17th. |
 |
| USDJPY Elliott wave analysis and forecast for June 10th to June 17th. |
 |
| USDJPY Elliott wave analysis and forecast for June 10th to June 17th. |
USDCAD Elliott wave analysis and forecast for June 10th to June 17th.
Long positions from corrections over 1.2516 with a target of 1.2790 – 1.2861 are the main scenario.
Alternative scenario: The pair will continue to fall to levels of 1.2410 – 1.2280 if it breaks and consolidates below the level of 1.2516.
On the daily chart, it appears that a descending corrective has completed as the fourth wave 4 of larger degree, and the fifth wave 5 has begun to form. On the H4 chart, the first counter-trend wave of smaller degree 1 of (1) of 5 has developed, and the second wave 2 of (1) of 5 is developing as a local correction. On the H1 chart, it appears that wave an of 2 has developed, and wave b of 2 is forming, with wave (a) of b unfolding as part of it. The pair will continue to rise to 1.2790 – 1.2861 if this assumption is right. In this situation, the level of 1.2516 is significant because if it is broken, the pair will continue to fall to the levels of 1.2410 – 1.2280.
 |
| USDCAD Elliott wave analysis and forecast for June 10th to June 17th. |
 |
| USDCAD Elliott wave analysis and forecast for June 10th to June 17th. |
 |
| USDCAD Elliott wave analysis and forecast for June 10th to June 17th. |
GOLD Elliott wave analysis and forecast for June 10th to June 17th.
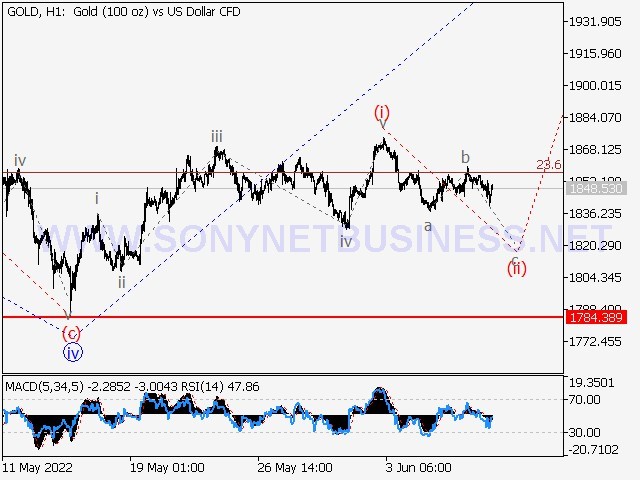
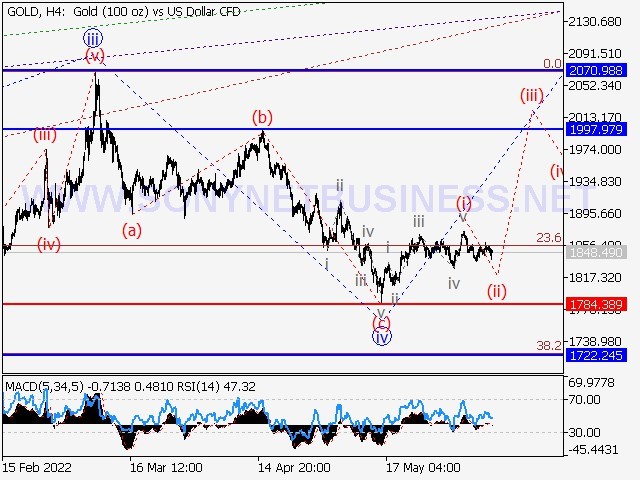
Long positions from corrections over 1784.38 with a goal of 1997.97 – 2070.98 are the main scenario.
Alternative scenario: The pair will continue to fall to levels of 1722.24 – 1616.95 if it breaks and consolidates below the level of 1784.38.
On the daily chart, the third wave of larger degree (3) is still developing, with the fifth wave 5 of (3) forming inside. On the H4 chart, wave iii of 5 appears to be complete, and the fourth wave iv of 5 has formed as a downward correction.On the H1 chart, the fifth wave v of 5 is presumably developing, with the first counter-trend wave I of v forming and a local correction (ii) of v developing inside. If the assumption is right, the pair will continue to increase following the correction to values between 1997.97 and 2070.98. In this situation, the level of 1784.38 is crucial because if it is broken, the pair will continue to fall to the levels of 1722.24 – 1616.95.




.png)
.png)