EURUSD : Elliott wave analysis and forecast for 22.07.22 – 29.07.22
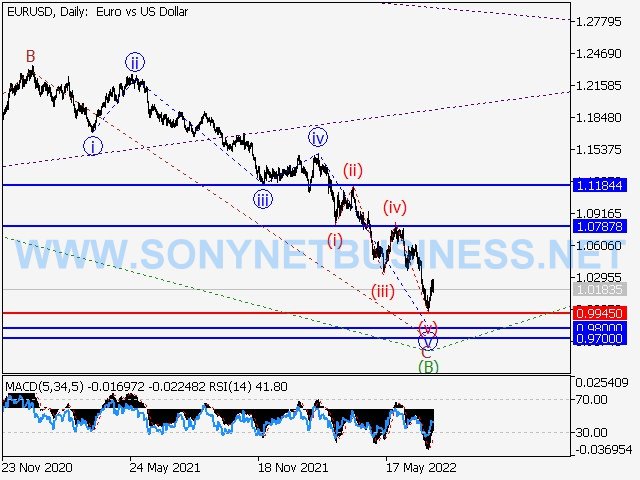
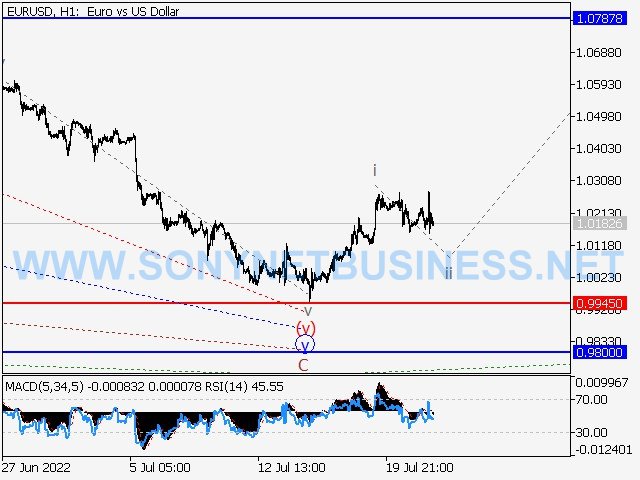
The main scenario is to think about taking long positions from corrections above level 0.9945 with a target between 1.0787 and 1.1184.
An alternative possibility is that the pair will continue to decline to levels between 0.9800 and 0.9700 with a breakout and consolidation below the level of 0.9945.
Analysis: A descending corrective must have ended as wave B of a bigger degree on the daily chart, with wave C of (B) finishing inside. The rising wave (C) is formed on the 4-hour chart, indicating that wave v of C of (B) must have completed. The inceptive wave of a smaller degree I of I of 1 of (C) must have formed in the hourly chart, and the corrective wave ii of I of 1 of (C) is currently developing. If the assumption is true, the pair will continue to rise until it reaches levels between 1.0787 and 1.1184 when the correction is finished. In this scenario, 0.9945 is the key level because a breakout there would allow the pair to continue sliding to levels between 0.9800 and 0.9700.
 |
| EURUSD : Elliott wave analysis and forecast for 22.07.22 – 29.07.22 |
 |
| EURUSD : Elliott wave analysis and forecast for 22.07.22 – 29.07.22 |
 |
| EURUSD : Elliott wave analysis and forecast for 22.07.22 – 29.07.22 |
GBPUSD : Elliott wave analysis and forecast for 22.07.22 – 29.07.22
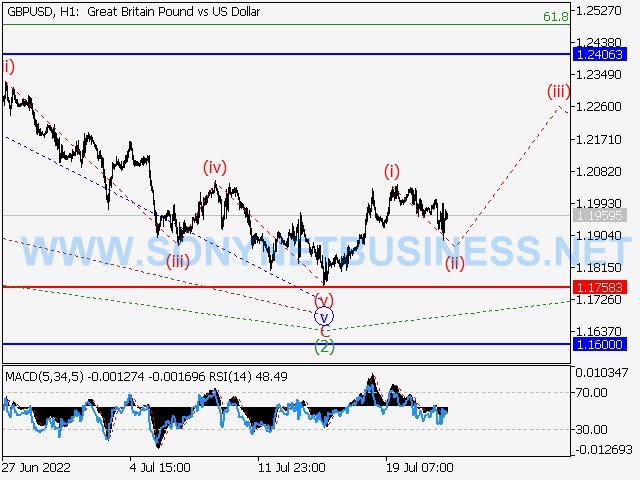
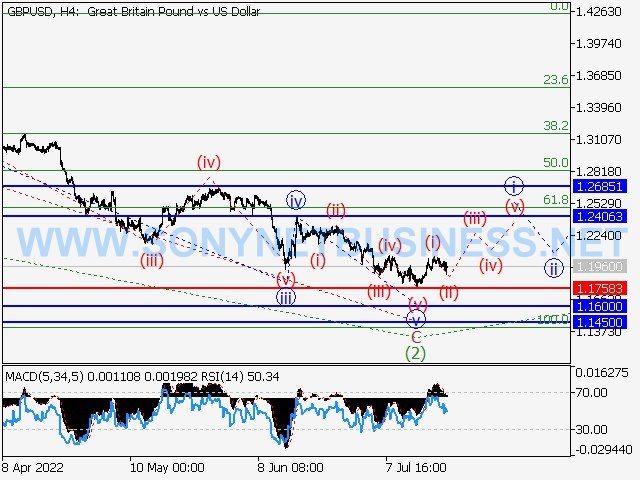
The primary scenario is to take into account long positions from corrections above the level of 1.1758, with a target range of 1.2406 to 1.2685.
An alternative possibility is that the pair will continue to fall to levels between 1.1600 and 1.1450 with a breakout and consolidation above the level of 1.1758.
Analysis: On the daily chart, the first wave of greater magnitude (1) has formed, and wave (2) has resulted in the development of a downward corrective. On the H4 chart, wave C of (2) has finished, and the fifth wave v of C has formed as a result. On the H1 chart, a first wave of a lesser degree I of 1 of (3) appears to be forming inside the third wave of a greater degree (3) of v. The pair will increase to the levels of 1.2406 - 1.2685 if the assumption is right. In this scenario, the level of 1.1758 is crucial since a breakout would allow the pair to keep falling to the levels of 1.1600 - 1.1450.
 |
| GBPUSD : Elliott wave analysis and forecast for 22.07.22 – 29.07.22 |
 |
| GBPUSD : Elliott wave analysis and forecast for 22.07.22 – 29.07.22 |
 |
| GBPUSD : Elliott wave analysis and forecast for 22.07.22 – 29.07.22 |
USDJPY : Elliott wave analysis and forecast for 22.07.22 – 29.07.22
Main scenario: From corrections above the level of 134.78, take into account long positions with a target of 142.36 to 145.00.
An alternative possibility is that the pair will continue to fall to levels between 131.72 and 127.21 if it breaks through and consolidates below the level of 134.78.
Analysis: Wave 3 of the greater degree (3) is still forming as part of the third wave, which is developing on the daily chart. On the H4 chart, wave (iii) of v, the fifth wave of smaller degree v of 3, is ostensibly developing. It appears that wave iii of (iii) and the corrective wave iv of (iii) on the H1 chart have finished. If this presumption is true, the pair will increase further, reaching 142.36 to 145.00. In this case, the level of 134.78 is crucial because a break of it would allow the pair to continue falling to the levels of 131.72 and 127.21.
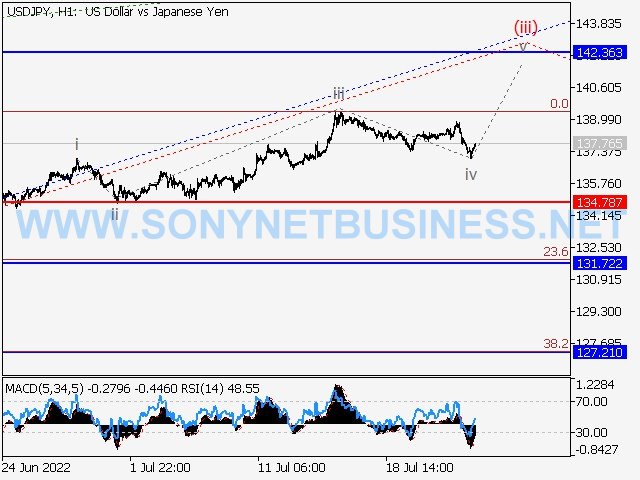 |
| USDJPY : Elliott wave analysis and forecast for 22.07.22 – 29.07.22 |
 |
| USDJPY : Elliott wave analysis and forecast for 22.07.22 – 29.07.22 |
 |
| USDJPY : Elliott wave analysis and forecast for 22.07.22 – 29.07.22 |
USDCHF : Elliott wave analysis and forecast for 22.07.22 – 29.07.22
The primary scenario is to think about taking long positions on corrections over the level of 0.9650 with a target of 1.0200 to 1.0400.
An alternative possibility is that the pair will continue to decline to levels between 0.9492 and 0.9285 after breaking out and consolidating below the level of 0.9650.
Analysis: Wave 3 of (3) is forming as the third wave of a bigger degree (3) that is growing on the daily chart. In the H4 chart, the third wave of smaller degree iii of 3 formed, and the fourth wave iv of 3 has now finished as a downward corrective. According to the H1 chart, wave I of v and wave (ii) of v have finished, and wave (iii) of v is currently forming inside. If the assumption is accurate, the pair will keep increasing until it reaches values between 1.0200 and 1.0400. In this case, the value of 0.9650 is crucial. If it breaks out, the pair will be free to keep sliding until it reaches levels of 0.9492 - 0.9285.
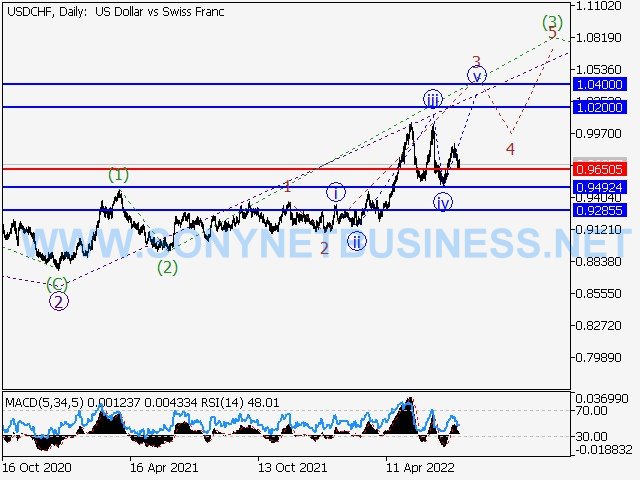 |
| USDCHF : Elliott wave analysis and forecast for 22.07.22 – 29.07.22 |
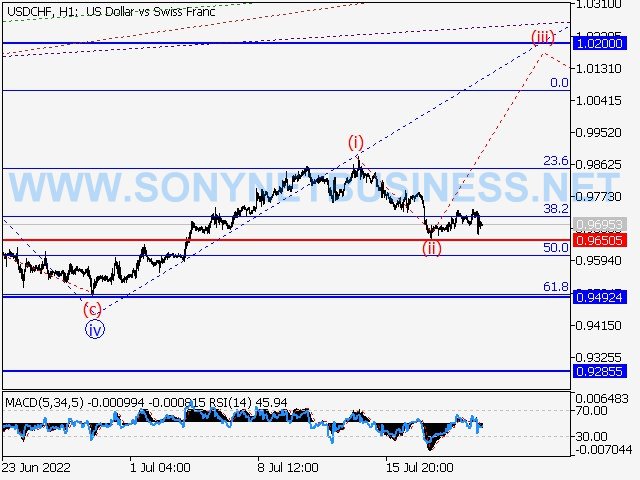 |
| USDCHF : Elliott wave analysis and forecast for 22.07.22 – 29.07.22 |
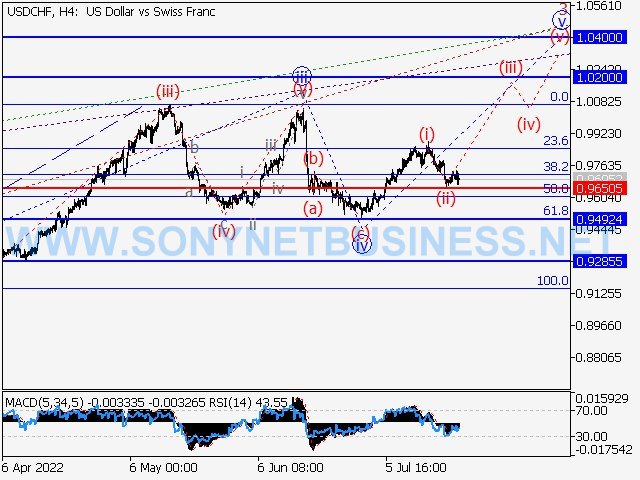 |
| USDCHF : Elliott wave analysis and forecast for 22.07.22 – 29.07.22 |
USDCAD : Elliott wave analysis and forecast for 22.07.22 – 29.07.22
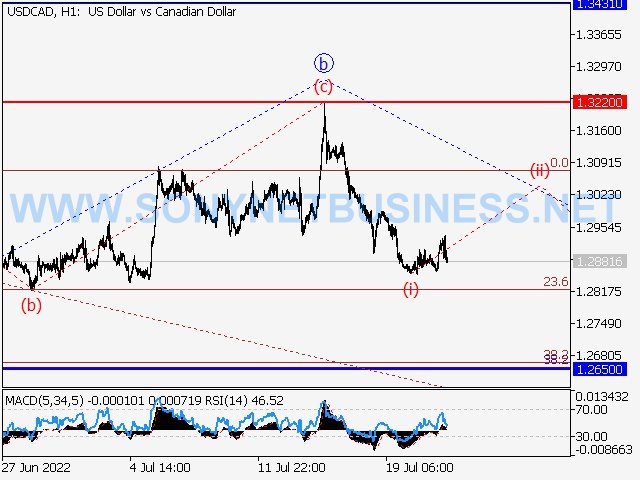
The primary scenario is to think about taking short positions from corrections below the level of 1.3220 with a target range of 1.2650-1.2540.
An alternative scenario is that the pair will continue to rise to the levels of 1.3431–1.3600 if it breaks out and consolidates above the level of 1.3220.
Analysis: Sub-wave 1 of the greater degree (1) of 5's first wave must be finished inside the daily period. On the 4-hour chart, the downward correction is forming as the second wave 2 of (1), with sub-wave b of wave 2 forming as a component of it. Wave I of c, of a smaller degree, has finished, and wave (ii) of c, a local correction, is growing inside. Wave (c) of 2 is emerging in the hourly timeframe. If the assumption is accurate, the pair will keep declining until it reaches values between 1.2650 and 1.2540. In this scenario, 1.3220 is the key milestone since a breakout there would allow the pair to continue advancing to levels between 1.3431 and 1.3600.
 |
| USDCAD : Elliott wave analysis and forecast for 22.07.22 – 29.07.22 |
 |
| USDCAD : Elliott wave analysis and forecast for 22.07.22 – 29.07.22 |
 |
| USDCAD : Elliott wave analysis and forecast for 22.07.22 – 29.07.22 |
WTI Crude Oil : Elliott wave analysis and forecast for 22.07.22 – 29.07.22
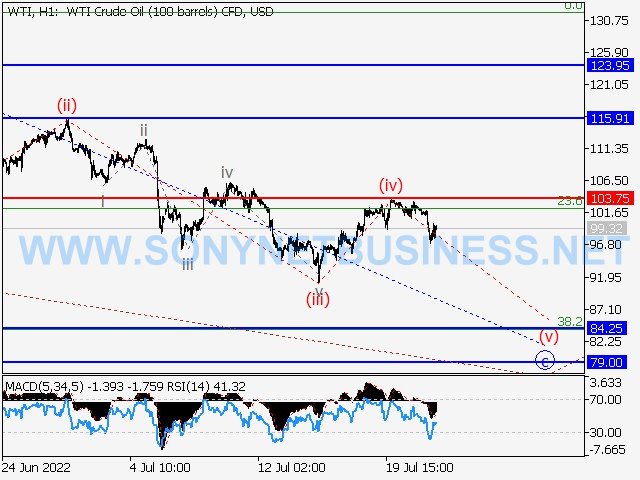
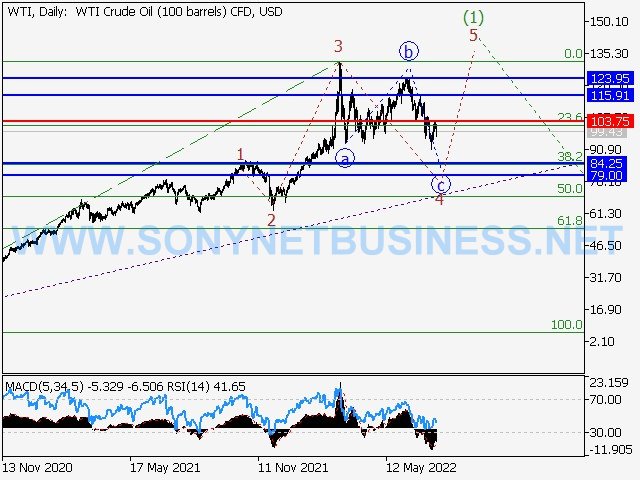
The primary scenario is to think about taking short positions from corrections below the level of 103.75 with a target range of 84.25 to 79.00.
An alternative possibility is that the asset will continue to rise to levels between 115.91 and 123.95 after breaking out and consolidating above the level of 103.75.
Analysis: Wave 3 of (1) has developed inside the first wave of bigger degree (1), which is apparently still developing on the daily chart. On the H4 chart, a downward correction is likely developing as the fourth wave 4 of (1), with wave c of 4 developing as a component. Evidently, wave (iii) of c developed on the H1 chart. As wave (iv) of c has finished, a local correction has formed. The development of wave (v) of c has started. If the assumption is accurate, the price will continue to decline following the correction to the range of 84.25 to 79.00. In this scenario, the level of 103.75 is crucial since a breakout there would allow for further price growth to levels between 115.91 and 123.95.
 |
| WTI Crude Oil : Elliott wave analysis and forecast for 22.07.22 – 29.07.22 |
 |
| WTI Crude Oil : Elliott wave analysis and forecast for 22.07.22 – 29.07.22 |
 |
| WTI Crude Oil : Elliott wave analysis and forecast for 22.07.22 – 29.07.22 |
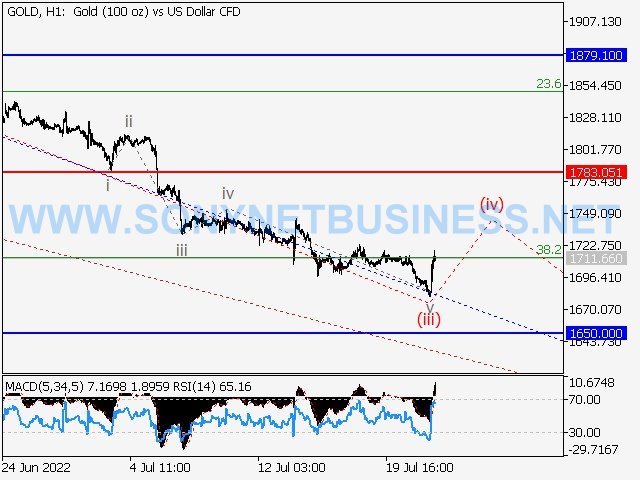
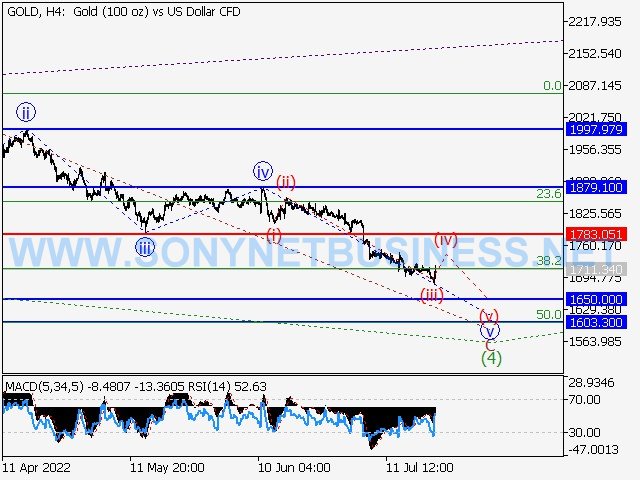
XAUUSD : Elliott wave analysis and forecast for 22.07.22 – 29.07.22
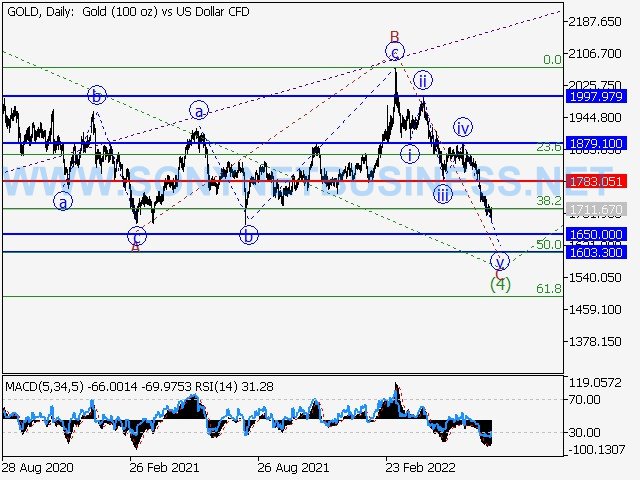
Consider short positions from corrections below the level of 1783.05 with a target of 1650.00 - 1603.30. This is the main scenario.
An alternative possibility is that the pair will continue to rise to the levels of 1879.10 and 1997.97 after breaking out and consolidating above the level of 1783.05.
Analysis: On the daily chart, a bearish correction is still forming as the fourth wave of bigger degree (4), with wave C of (4) forming inside. On the H4 chart, the third wave of smaller degree (iii) of v, which is a portion of the fifth wave v of C, looks to be completing. According to the H1 chart, a local correction in the form of wave (iv) of v is currently taking shape. If this supposition is true, after a local adjustment (iv) of v forms, the pair will keep decreasing to 1650.00 - 1603.30. In this scenario, the level of 1783.05 is crucial since a breakout there would allow the pair to continue advancing to levels between 1997.97 and 1879.10
 |
| XAUUSD : Elliott wave analysis and forecast for 22.07.22 – 29.07.22 |
 |
| XAUUSD : Elliott wave analysis and forecast for 22.07.22 – 29.07.22 |
 |
| XAUUSD : Elliott wave analysis and forecast for 22.07.22 – 29.07.22 |


.png)
.png)