EURUSD : Elliott wave analysis and forecast for July 1 through July 8, 2022.
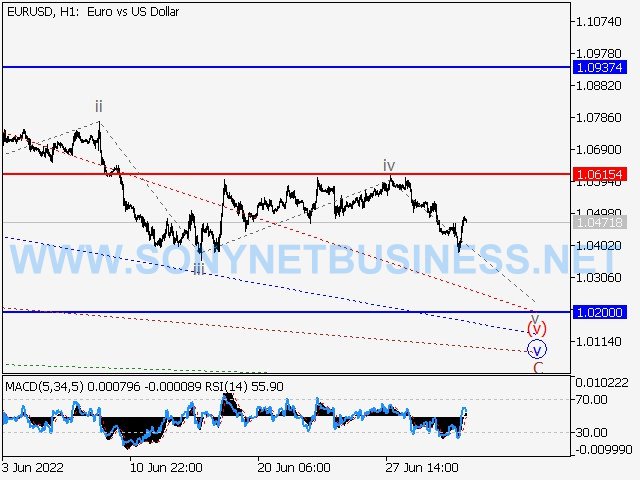
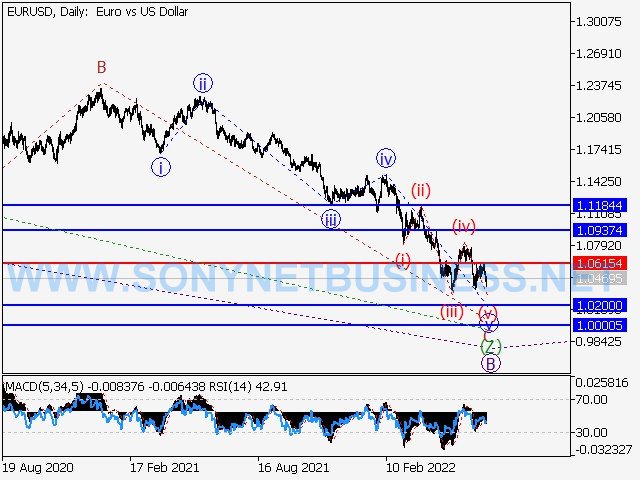
Consider taking short positions from corrections below the level of 1.0615 with a goal of 1.0200–1.00000 as the main scenario.
An alternative possibility is that the pair will continue to rise to levels between 1.0937 and 1.1184 after breaking out and consolidating above the level of 1.0615.
Analysis: According to the daily chart, the last wave (Z) of wave B is emerging as part of a bearish correction that is likely still developing as wave B of a larger degree. On the H4 chart, wave C of (Z) seems to be developing, with the fifth wave of smaller degree v of C forming inside. Wave (v) of (v) is formed on the H1 chart, and wave (v) of (v) has unfolded within it. Inside, wave v of (v) is growing. If the assumption is accurate, the pair will keep falling until it reaches levels between 1.0200 and 1.0000. In this case, the level of 1.0615 is crucial. The pair will be able to continue increasing after it breaks out to levels between 1.0937 and 1.1184.
 |
| EURUSD : Elliott wave analysis and forecast for July 1 through July 8, 2022. |
 |
| EURUSD : Elliott wave analysis and forecast for July 1 through July 8, 2022. |
 |
| EURUSD : Elliott wave analysis and forecast for July 1 through July 8, 2022. |
GBP/USD : Elliott wave analysis and forecast for July 1 through July 8, 2022.
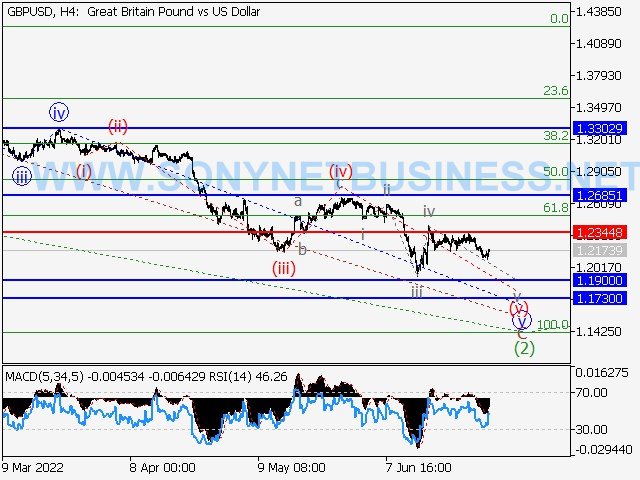
The primary scenario is to think about taking short positions on corrections below the level 1.2344 with a target range of 1.1900–1.1730.
Alternative scenario: The asset will continue to rise to the levels of 1.2685 to 1.3302 with a breakout and consolidation above the level of 1.2344.
Analysis: The downward corrective is developing as wave 1 of a bigger degree, and the first wave (1) of the larger degree finished in the daily timeframe (2). Within the next four hours, wave C of (2) will evolve into wave v, which will be its fifth wave. The local correction is complete, wave iv of (v) and wave v of (v) are building internally, and the fifth wave of a smaller degree (v) of v must be developing in the hourly timeframe. If the assumption is accurate, the pair will keep decreasing until it reaches levels between 1.1900 and 1.1730. In this case, level 1.2344 is crucial since a breakout there would allow the pair to continue rising to levels between 1.2685 and 1.3302.
 |
| GBP/USD : Elliott wave analysis and forecast for July 1 through July 8, 2022. |
 |
| GBP/USD : Elliott wave analysis and forecast for July 1 through July 8, 2022. |
 |
| GBP/USD : Elliott wave analysis and forecast for July 1 through July 8, 2022. |
USD/JPY : Elliott wave analysis and forecast for July 1 through July 8, 2022.
The primary scenario is to think about taking short positions from corrections below the level of 137.12 with a target range of 130.14 to 125.90.
An alternative scenario is that the asset will continue to rise to levels between 140.00 and 145.00 after breaking out and consolidating above the level of 137.12.
Analysis: Presumably, wave 3 of (3) of a bigger degree has already been completed inside, and wave 3 of (3) is still forming in the daily timeframe. In the H4 timeframe, the fourth wave 4 of a smaller degree v of 3 formed as the fifth wave, and the downward corrective is still forming (3). In the hourly chart, wave an of wave 4 of a smaller degree is developing. If the assumption is accurate, the pair will keep falling until it reaches values between 130.14 and 125.90. In this case, level 137.12 is crucial since a breakout there would allow the pair to continue advancing to levels between 140.00 and 145.00.
 |
| USD/JPY : Elliott wave analysis and forecast for July 1 through July 8, 2022. |
 |
| USD/JPY : Elliott wave analysis and forecast for July 1 through July 8, 2022. |
 |
| USD/JPY : Elliott wave analysis and forecast for July 1 through July 8, 2022. |
USDCHF : Elliott wave analysis and forecast for July 1 through July 8, 2022.
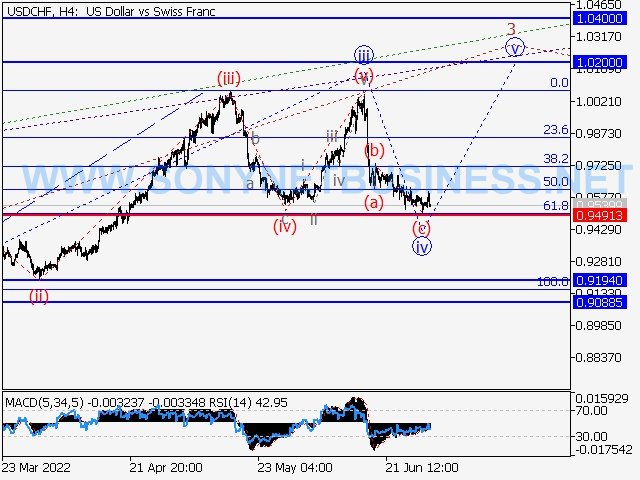
Main scenario: Once a correction emerged, think about taking long positions above the level of 0.9491 with a target of 1.0200 to 1.0400.
An alternative possibility is that the pair will continue to decline to levels between 0.9194 and 0.9088 if it breaks out and consolidates below the level of 0.9491.
Analysis: Wave 3 of (3) is emerging as the third wave of bigger degree (3) on the daily chart. On the H4 chart, a local correction appears to have developed as the fourth wave iv of the smaller degree iii of 3 after the third wave of that degree finished forming. On the H1 chart, wave (c) of iv appears to be finished. If the assumption is accurate, the pair will increase to values between 1.0200 and 1.0400. In this case, the value of 0.9491 is crucial. If it breaks out, the pair will be free to keep sliding until it reaches levels of 0.9194 and 0.9088.
 |
| USDCHF : Elliott wave analysis and forecast for July 1 through July 8, 2022. |
 |
| USDCHF : Elliott wave analysis and forecast for July 1 through July 8, 2022. |
 |
| USDCHF : Elliott wave analysis and forecast for July 1 through July 8, 2022. |
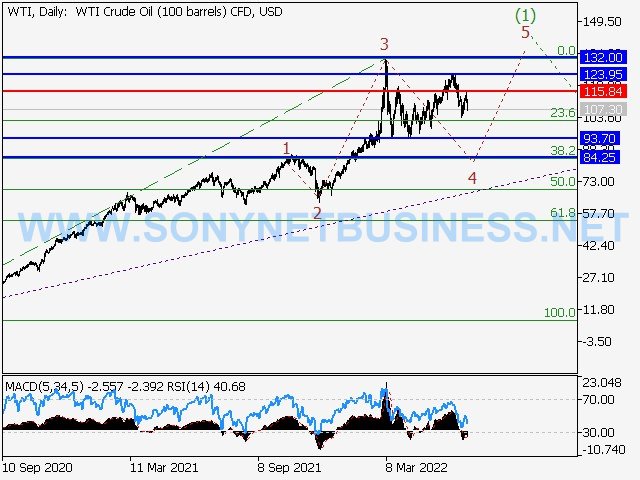
WTI Crude Oil : Elliott wave analysis and forecast for July 1 through July 8, 2022.
The primary scenario is to think about taking short positions from corrections below the level of 115.84 with a target range of 93.70 to 84.25.
An alternative possibility is that the asset will continue to rise to levels between 123.95 and 132.00 after breaking out and consolidating above the level of 115.84.
Analysis: based on the daily chart, wave 3 of the first wave (1) of a larger degree has likely formed inside. The fourth wave 4 of (1), which is apparently a local correction, is developing as wave c of 4 in the H4 chart. Waves I and (ii) of C must have finished in the H1 timeframe, and wave (iii) of C should be developing. If the assumption is accurate, the asset's price will keep decreasing until it reaches the range of 93.70 to 84.25. Milestone 115.84 is the key level in this scenario since a breach there would allow the price to rise further to levels between 123.95 and 132.00.
 |
| WTI Crude Oil : Elliott wave analysis and forecast for July 1 through July 8, 2022. |
 |
| WTI Crude Oil : Elliott wave analysis and forecast for July 1 through July 8, 2022. |
 |
| WTI Crude Oil : Elliott wave analysis and forecast for July 1 through July 8, 2022. |
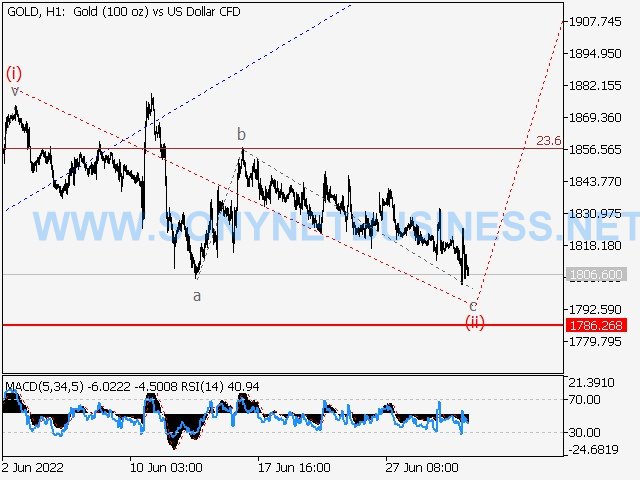
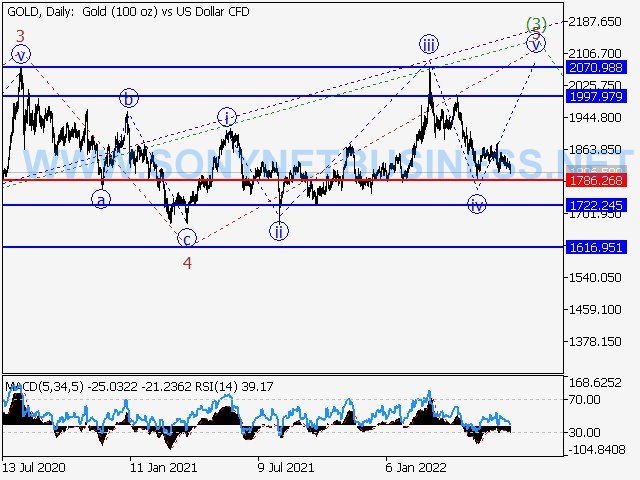
XAUUSD : Elliott wave analysis and forecast for July 1 through July 8, 2022.
the 1997.97–2070.98 range as a target for long positions from corrections above the level of 1786.26.
An alternative possibility is that the pair will continue to decline to the levels of 1722.24 - 1616.95 after breaking out and consolidating below the level of 1786.26.
Analysis: In the daily chart, wave (3) of a larger degree is still developing, and wave (3)'s fifth wave 5 is forming inside. The fourth wave of wave iv of wave 5 and wave v of wave 5 began to form in the H4 chart as the downward correction was finished. It is likely that the local correction (ii) of v is about to end and that the first wave of a reduced degree I of v finished in the H1 timeframe. The pair will increase further to the levels of 1997.97 - 2070.98 if the assumption is right. In this situation, the level of 1786.26 is crucial because a break of it would allow the pair to continue falling to the levels of 1722.24 and 1616.95.
 |
| XAUUSD : Elliott wave analysis and forecast for July 1 through July 8, 2022. |
 |
| XAUUSD : Elliott wave analysis and forecast for July 1 through July 8, 2022. |
 |
| XAUUSD : Elliott wave analysis and forecast for July 1 through July 8, 2022. |


.png)
.png)