EURUSD : Elliott wave analysis and forecast for 02.09.22 – 09.09.22
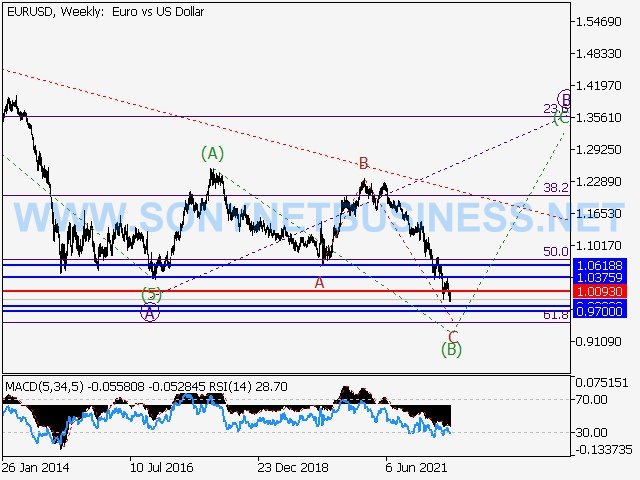
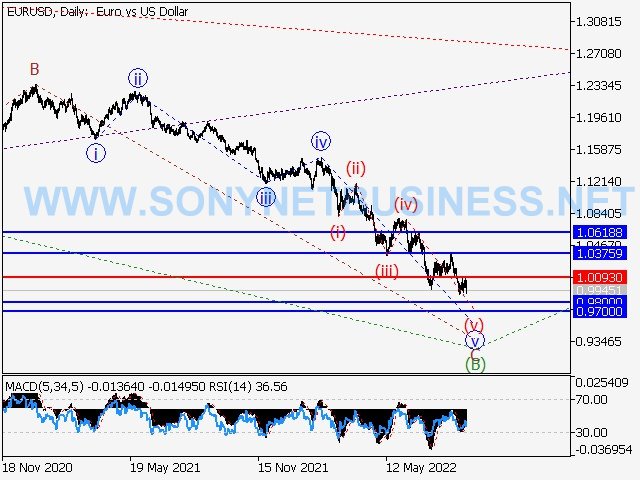
The primary scenario is to think about taking short positions on corrections below the level of 1.0093 with a goal of 0.9800 to 0.9700.
An alternative scenario is that the pair will continue to rise to the levels of 1.0375–1.0618 if it breaks out and consolidates above the level of 1.0093.
Analysis: On the weekly chart, an irregular flat ()-()-(C) indicates that a corrective wave of greater degree B is apparently still developing. On the daily chart, wave (B) of (B) looks to have finished forming, with wave (B) of (B) acting as its component. On the H4 chart, the fifth wave (v) of (v) of C is developing, with a local corrective finished as the fourth wave of smaller degree iv of (v). The formation of wave (v) continues. If the assumption is accurate, the pair will keep falling until it reaches values between 0.9800 and 0.9700. In this case, the level of 1.0093 is crucial. The pair will be able to continue climbing once it breaks out to levels between 1.0375 and 1.0618.
 |
| EURUSD : Elliott wave analysis and forecast for 02.09.22 – 09.09.22 |
 |
| EURUSD : Elliott wave analysis and forecast for 02.09.22 – 09.09.22 |
 |
| EURUSD : Elliott wave analysis and forecast for 02.09.22 – 09.09.22 |
GBPUSD : Elliott wave analysis and forecast for 02.09.22 – 09.09.22
The primary scenario is to think about taking short positions on corrections below the level of 1.1898 with a target range of 1.1402–1.1150.
An alternative scenario is that the pair will continue to climb to levels between 1.2143 and 1.2406 if it breaks out and consolidates above the level of 1.1898.
Analysis: Wave (1) of V, the fifth wave of bigger degree V, is apparently developing on the daily chart. On the H4 chart, wave iii of wave 5 is forming inside the fifth wave of smaller degree 5 of (1). On the H1 chart, it appears like wave (iii) of iii of 5 is developing, with wave v of (iii) continuing to build as a component of it. If the assumption is accurate, the pair will keep falling to levels between 1.1402 and 1.1150. In this scenario, the level of 1.1898 is crucial since a breach there would allow the pair to continue advancing to levels between 1.2143 and 1.2406.
 |
| GBPUSD : Elliott wave analysis and forecast for 02.09.22 – 09.09.22 |
 |
| GBPUSD : Elliott wave analysis and forecast for 02.09.22 – 09.09.22 |
 |
| GBPUSD : Elliott wave analysis and forecast for 02.09.22 – 09.09.22 |
USDJPY : Elliott wave analysis and forecast for 02.09.22 – 09.09.22
Main scenario: From corrections above the level of 134.07, think about taking long positions with a target of 145.00 to 148.00.
An alternative scenario is that the pair will continue to decline to levels between 130.36 and 127.35 after breaking out and consolidating below the level of 134.07.
Analysis: Wave 3 of wave (3) has formed as a component of the broader upward third wave of degree (3) that is emerging on the daily chart. On the H4 chart, the fourth wave 4 of (3) has finished forming, and the fifth wave 5 of (3) is still developing. On the H1 chart, it appears that the first wave of smaller degree I of 5 has formed. If this assumption is true, and a local corrective emerges as wave ii of 5, the pair will continue to rise to 145.00 - 148.00. In this case, the level of 134.07 is crucial because a breach of it would allow the pair to continue falling to levels between 130.36 and 127.35.
 |
| USDJPY : Elliott wave analysis and forecast for 02.09.22 – 09.09.22 |
 |
| USDJPY : Elliott wave analysis and forecast for 02.09.22 – 09.09.22 |
 |
| USDJPY : Elliott wave analysis and forecast for 02.09.22 – 09.09.22 |
USDCHF : Elliott wave analysis and forecast for 02.09.22 – 09.09.22
The primary scenario is to think about taking short positions from corrections below the level of 1.0052 with an initial aim of 0.9076 to 0.8918.
An alternative possibility is that the pair will continue to rise to levels between 1.0230 and 1.0350 after breaking out and consolidating above the level of 1.0052.
Analysis: On the daily chart, the fourth wave of larger degree (4) appears to have finished growing as an ascending corrective, and the fifth wave (5) of 5 began to take shape. On the H4 chart, wave I of 1 has formed inside the first wave of smaller degree 1 of (5). On the H1 chart, wave (c) of iii, which is a part of the local correction, appears to be reaching the end of wave ii of 1, which represents the entire correction. After wave (c) of iii forms, if the assumption is accurate, the pair will continue to decline to the levels 0.9076 - 0.8918. In this case, the level of 1.0052 is crucial. The pair will be able to continue gaining once it breaks out to levels between 1.0230 and 1.0350.
 |
| USDCHF : Elliott wave analysis and forecast for 02.09.22 – 09.09.22 |
 |
| USDCHF : Elliott wave analysis and forecast for 02.09.22 – 09.09.22 |
 |
| USDCHF : Elliott wave analysis and forecast for 02.09.22 – 09.09.22 |
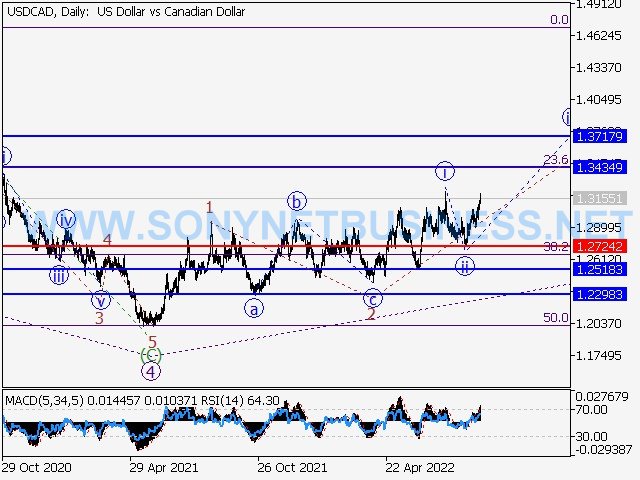
USDCAD : Elliott wave analysis and forecast for 02.09.22 – 09.09.22
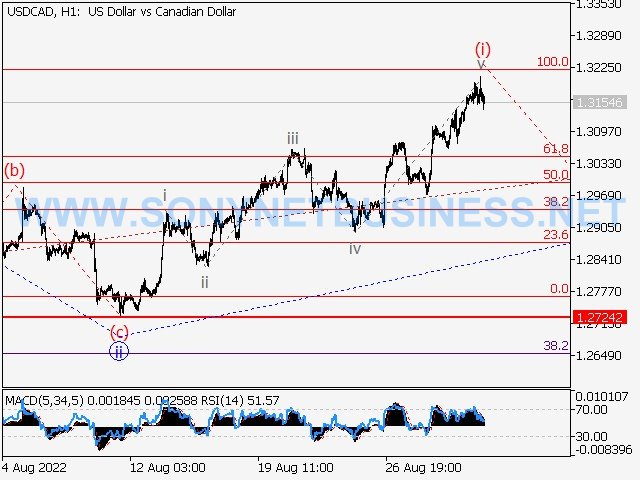
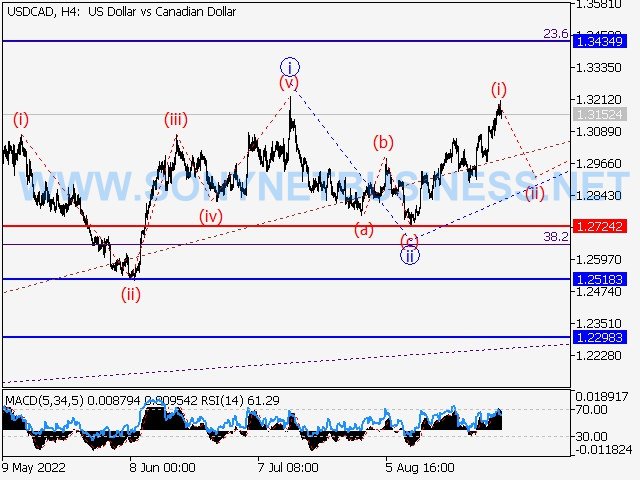
The primary scenario is to think about taking long positions from corrections above the level of 1.2724, with a target range of 1.3434 to 1.3717.
An alternative possibility is that the pair will continue to decline to levels between 1.2518 and 1.2298 after breaking out and consolidating below the level of 1.2724.
Analysis: On the daily chart, the bigger degree (1) of 5's first wave is ostensibly developing. Within it, wave 1 of (1) and wave 2 of a bearish correction were produced (1). Wave 1 is transitioning to Wave 3. On the H4 chart, the smaller degree I of the first wave of the third wave has formed, and wave ii of the third wave has finished developing locally. On the H1 chart, it appears like wave I of wave iii, the third wave iii of 3, is developing. If the assumption is true, after wave (ii) of iii has finished, the pair will continue to rise to the levels of 1.3434 - 1.3717. In this scenario, the level of 1.2724 is crucial because if it is broken, the pair will be able to continue falling to the levels of 1.2518 and 1.2298.
 |
| USDCAD : Elliott wave analysis and forecast for 02.09.22 – 09.09.22 |
 |
| USDCAD : Elliott wave analysis and forecast for 02.09.22 – 09.09.22 |
 |
| USDCAD : Elliott wave analysis and forecast for 02.09.22 – 09.09.22 |
WTI Crude Oil : Elliott wave analysis and forecast for 02.09.22 – 09.09.22
The primary scenario is to think about taking short positions from corrections below the level of 98.40 with a target range of 69.28 to 54.40.
An alternative possibility is that the asset will continue to rise to levels between 104.15 and 115.90 if it breaks out and consolidates above the level of 98.40.
Analysis: The daily chart appears to have created the first wave of greater degree (1), and the second wave, a downside correction, is currently developing (2). On the H4 chart, waves A and B of (2) appear to have developed, while wave C of (2) has begun to take shape. On the H1 chart, it appears that the first counter-trend wave of smaller degree I of I of C is developing. If this supposition is true, the asset's price will keep decreasing until it reaches the range of 69.28 and 54.40. In this scenario, the level of 98.40 is crucial since a breach there would allow for further price growth to levels between 104.15 and 115.90.
 |
| WTI Crude Oil : Elliott wave analysis and forecast for 02.09.22 – 09.09.22 |
 |
| WTI Crude Oil : Elliott wave analysis and forecast for 02.09.22 – 09.09.22 |
 |
| WTI Crude Oil : Elliott wave analysis and forecast for 02.09.22 – 09.09.22 |
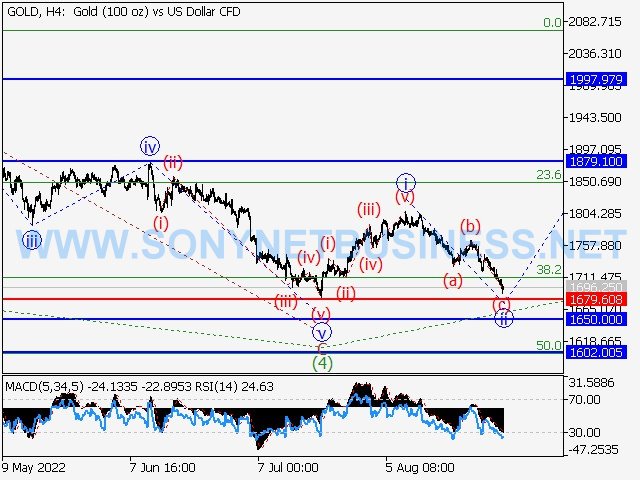
XAUUSD : Elliott wave analysis and forecast for 02.09.22 – 09.09.22
The primary scenario is to think about taking long positions from corrections over the level of 1679.60 with a target range of 1879.10 to 1997.97.
An alternative scenario is that the pair will continue to fall to levels between 1650.00 and 1602.00 with a breakout and consolidation below the level of 1679.60.
Analysis: On the daily chart, wave (4) of the larger fourth wave (4) appears to have completed inside of a falling corrective. On the H4 chart, the fifth wave (5), which includes the first counter-trend wave of smaller degree I of 1 of (5) completed as its component, looks to be forming. On the H1 chart, wave (c) of ii of the local correction, which was the second wave ii of wave 1, has completed developing. The pair will increase to the levels of 1879.10 - 1997.97 if the assumption is accurate. In this case, the level of 1679.60 is crucial because a break of it would allow the pair to continue falling to levels between 1650.00 and 1602.00.
 |
| XAUUSD : Elliott wave analysis and forecast for 02.09.22 – 09.09.22 |
 |
| XAUUSD : Elliott wave analysis and forecast for 02.09.22 – 09.09.22 |
 |
| XAUUSD : Elliott wave analysis and forecast for 02.09.22 – 09.09.22 |


.png)
.png)