EURUSD : Elliott wave analysis and forecast for 06.01.23 – 13.01.23
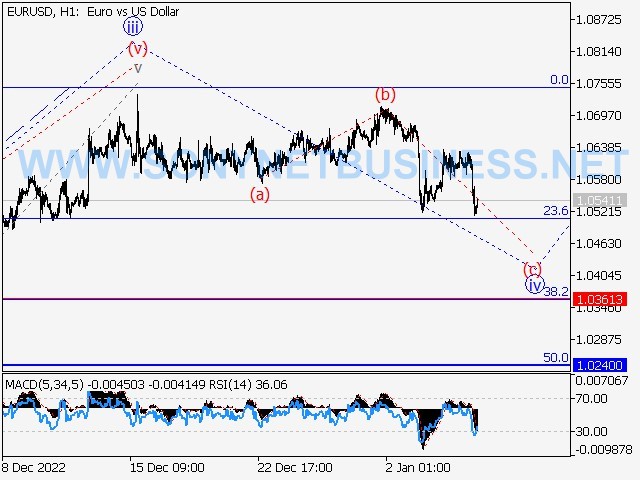
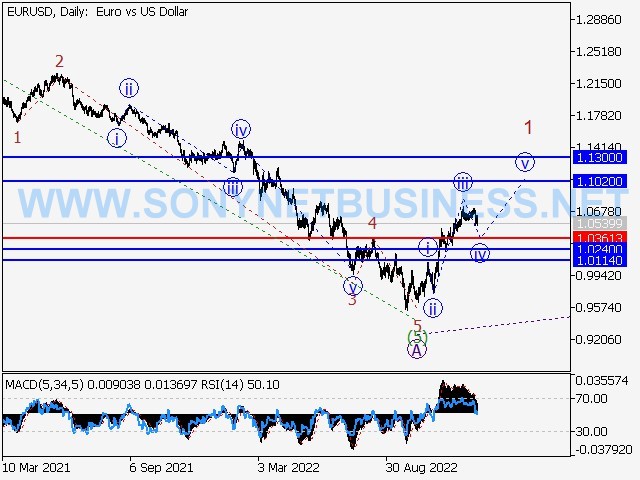
Main scenario: Once a correction emerged, take into account long positions above the level of 1.0361 with a target of 1.1020 to 1.1300.
An alternative scenario is that the pair will continue to decline to levels between 1.0240 and 1.0114 with a breakout and consolidation below 1.0361.
Analysis: On the daily chart, a bearish wave of greater degree A is likely complete, with the fifth wave (5) of A forming as a part of it. On the H4 chart, it appears that an ascending wave B began to form, with the first counter-trend wave of lesser degree 1 of (A) of B forming as a part of it. H1 chart: Wave iii of 1 has likely finished, and wave (iv) of 1 is currently building as a local correction. If the assumption is accurate, the pair will continue to increase after the correction to levels between 1.1020 and 1.1300. In this case, it's crucial to maintain the level at 1.0361. If it breaks out, the pair will be free to keep sliding until it reaches levels between 1.0240 and 1.0114.
 |
| EURUSD : Elliott wave analysis and forecast for 06.01.23 – 13.01.23 |
 |
| EURUSD : Elliott wave analysis and forecast for 06.01.23 – 13.01.23 |
 |
| EURUSD : Elliott wave analysis and forecast for 06.01.23 – 13.01.23 |
GBPUSD : Elliott wave analysis and forecast for 06.01.23 – 13.01.23
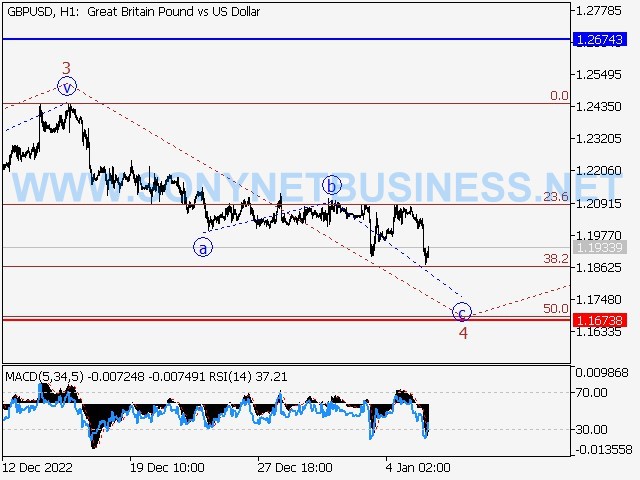
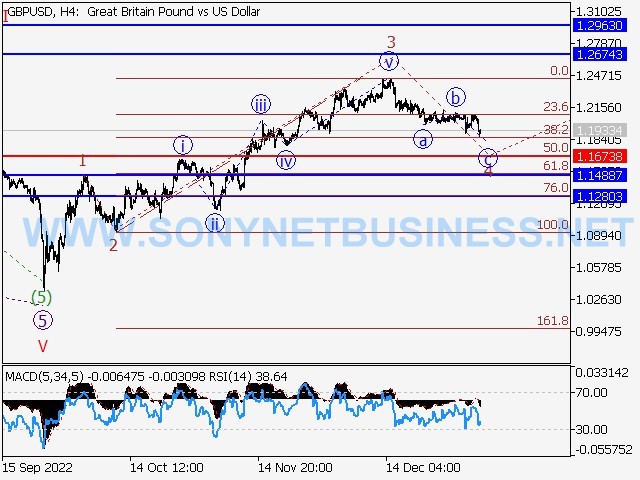
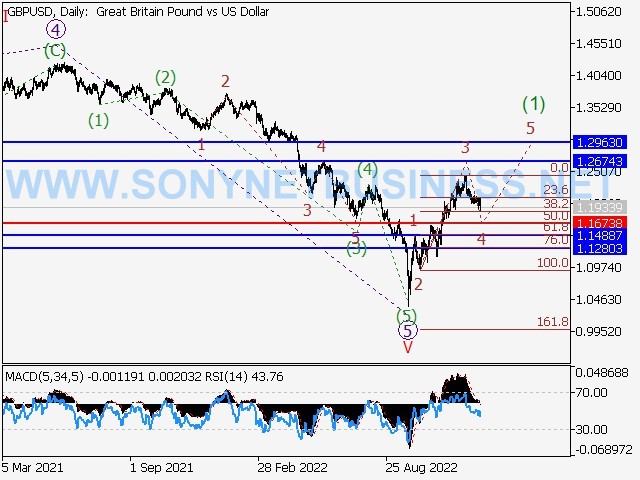
Main scenario: After the correction is finished, consider taking long positions above the level of 1.1673 with a goal of 1.2674–1.2963.
An alternative possibility is that the pair will continue to decline to levels between 1.1488 and 1.1280 with a breakout and consolidation below the level of 1.1673.
Analysis: Wave 5 of V was generated as the fifth wave of bigger degree V, which is thought to have completed developing on the daily chart. On the H4 chart, the third wave of the lesser degree 3 of the first ascending wave (1) formed as it began to take shape. A descending corrective that is the fourth wave 4 of (1) and includes wave an of 4 is seen forming on the H1 chart. If the assumption is accurate, the pair will increase further after the correction, reaching values between 1.2674 and 1.2963. In this case, the level of 1.1673 is crucial because a break of it would allow the pair to continue falling to levels between 1.1488 and 1.1280.
 |
| GBPUSD : Elliott wave analysis and forecast for 06.01.23 – 13.01.23 |
 |
| GBPUSD : Elliott wave analysis and forecast for 06.01.23 – 13.01.23 |
 |
| GBPUSD : Elliott wave analysis and forecast for 06.01.23 – 13.01.23 |
USDCHF : Elliott wave analysis and forecast for 06.01.23 – 13.01.23
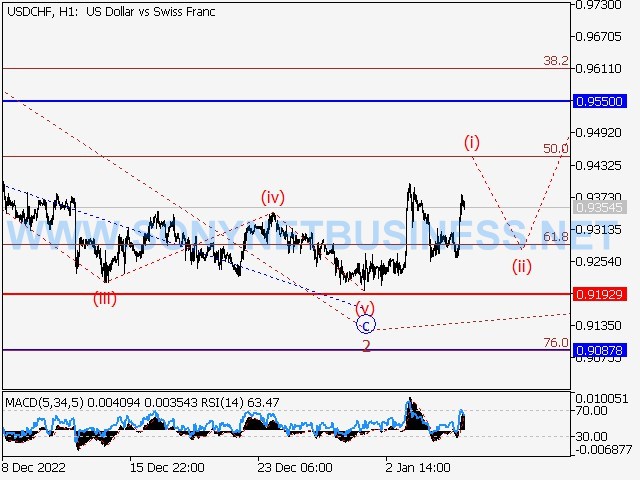
The primary scenario is to take into account long positions from corrections above the level of 0.9192 with a goal of 0.9550 to 0.9810.
An alternative possibility is that the pair will continue to decline to levels between 0.9087 and 0.8925 after breaking out and consolidating below the level of 0.9192.
Analysis: On the daily chart, a bullish third wave of greater degree (3) is forming, with wave 1 of (3) forming inside. On the H4 chart, a downward correction appears to have ended as wave 2 of (3), with wave c of 2 forming as a part of it. On the H1 chart, it appears that the third wave 3 of (3) began to form, with the first counter-trend wave of smaller degree I of I of 3 forming as a component of it. If the assumption is accurate, the pair will increase until it reaches values between 0.9550 and 0.9810. In this case, the level of 0.9192 is crucial. If it breaks out, the pair will be free to keep sliding until it reaches levels between 0.9087 and 0.8925.
 |
| USDCHF : Elliott wave analysis and forecast for 06.01.23 – 13.01.23 |
 |
| USDCHF : Elliott wave analysis and forecast for 06.01.23 – 13.01.23 |
 |
| USDCHF : Elliott wave analysis and forecast for 06.01.23 – 13.01.23 |
USDCAD : Elliott wave analysis and forecast for 06.01.23 – 13.01.23
The main scenario is to think about taking long positions from corrections over 1.3452 with a goal of 1.3975 to 1.4205.
An alternative scenario is that the pair will continue to decline to levels between 1.3220 and 1.2947 if it breaks out and consolidates below the level of 1.3452.
Analysis: Wave (3) of 5 is forming as the fifth wave of bigger degree 5 that is apparently developing on the daily chart. On the H4 chart, the third wave 3 of (3) is still developing. Its components are wave iii of 3 and wave-shaped correction iv of 3. The third wave's fifth v wave is currently forming. The H1 chart appears to show the formation of wave I of smaller degree, the first wave of v, and wave (ii) of v, the second wave of v. The pair will increase to the levels of 1.3975 to 1.4205 if the assumption is right. In this case, the level of 1.3452 is crucial because a break of it would allow the pair to continue falling to levels between 1.3220 and 1.2947.
 |
| USDCAD : Elliott wave analysis and forecast for 06.01.23 – 13.01.23 |
 |
| USDCAD : Elliott wave analysis and forecast for 06.01.23 – 13.01.23 |
 |
| USDCAD : Elliott wave analysis and forecast for 06.01.23 – 13.01.23 |
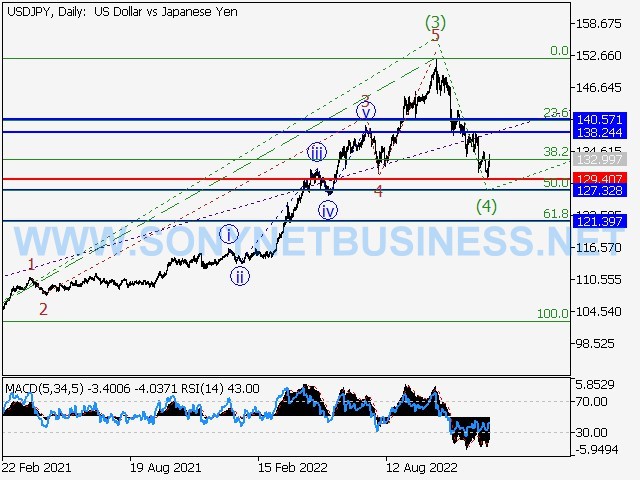
USDJPY : Elliott wave analysis and forecast for 06.01.23 – 13.01.23
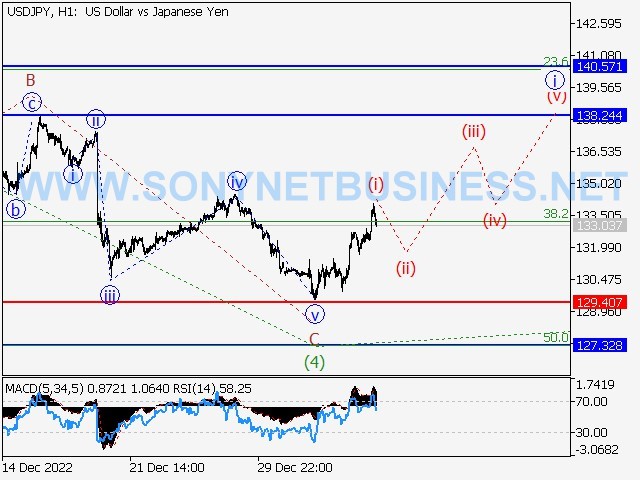
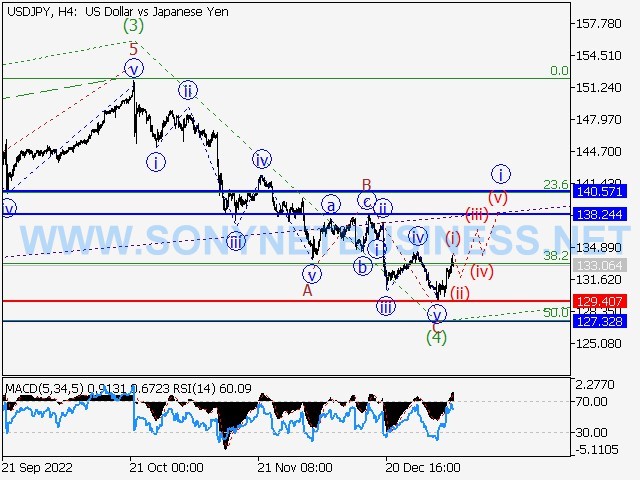
Main scenario: From corrections above the level of 129.40, consider long positions with a target of 138.24 to 140.57.
An alternative possibility is that the pair will continue to fall to levels between 127.32 and 121.39 if it breaks through and consolidates below the level of 129.40.
Analysis: On the daily chart, the upward third wave of bigger degree (3) has finished developing, and wave 5 of (3) has developed as a part of it. On the H4 chart, wave C of (4) has apparently finished and the fourth wave (4) has developed as a descending corrective. On the H1 chart, it appears that the fifth wave (5) began to form, with the first counter-trend wave of lesser degree I of 1 of (5) forming inside. The pair will increase to the levels of 138.24 - 140.57 if the assumption is right. In this scenario, the level of 129.40 is crucial since a breakout there would allow the pair to continue falling to levels between 127.32 and 121.39.
 |
| USDJPY : Elliott wave analysis and forecast for 06.01.23 – 13.01.23 |
 |
| USDJPY : Elliott wave analysis and forecast for 06.01.23 – 13.01.23 |
 |
| USDJPY : Elliott wave analysis and forecast for 06.01.23 – 13.01.23 |
WTI Crude Oil : Elliott wave analysis and forecast for 06.01.23 – 13.01.23
The main scenario is to think about taking short positions after corrections below the level of 84.05, with a target range of 63.00 to 54.50.
An alternative possibility is that the asset will continue to rise to levels between 104.00 to 124.09 after breaking out and consolidating above the level of 84.05.
Analysis: On the daily chart, the first wave of greater magnitude (1) is likely to have developed, and a negative corrective is still developing as the second wave (2). On the H4 chart, wave C of (2) is purportedly developing. It contains a local correction that manifests as C wave IV. On the H1 chart, wave (a) of iv appears to be finished, and wave (b) of iv is probably finished as well. After wave (c) of iv is finished, if the assumption is right, the price will keep dropping until it reaches levels 63.00 - 54.50. In this scenario, the level of 84.05 is crucial since a breakout there would allow the price to continue rising to levels between 104.00 and 124.09.
 |
| WTI Crude Oil : Elliott wave analysis and forecast for 06.01.23 – 13.01.23 |
 |
| WTI Crude Oil : Elliott wave analysis and forecast for 06.01.23 – 13.01.23 |
 |
| WTI Crude Oil : Elliott wave analysis and forecast for 06.01.23 – 13.01.23 |
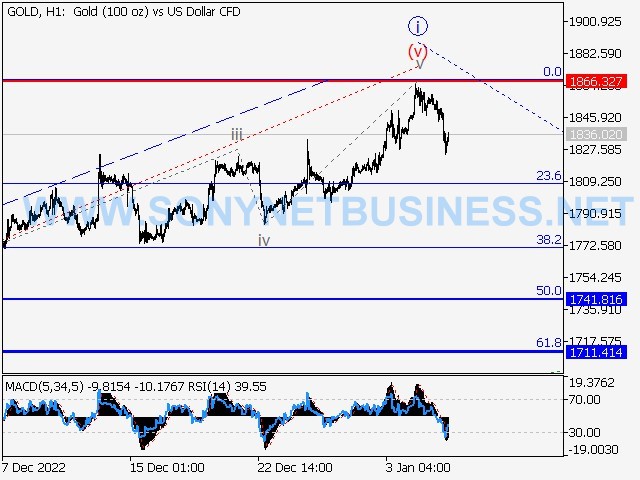
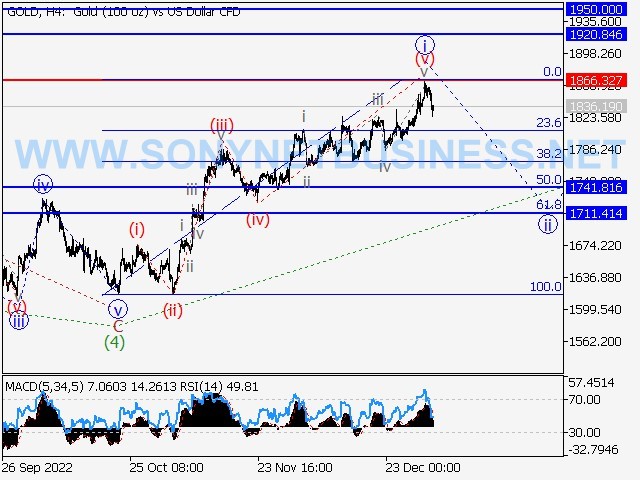
XAUUSD : Elliott wave analysis and forecast for 06.01.23 – 13.01.23
The primary scenario is to think about taking short positions on corrections below the level of 1866.32 with a target range of 1741.81–1711.41.
Alternative scenario: The pair will continue to rise to the levels of 1920.84 - 1950.00 with a breakout and consolidation above the level of 1866.32.
Analysis: On the daily chart, wave C of wave (4) has been completed inside what appears to be a downward corrective as the fourth wave (4) of larger degree. On the H4 chart, the fifth wave (5), which includes the first counter-trend wave of smaller degree I of 1 of (5) completed as its component, looks to be forming. As wave ii of wave 1 of (5) on the H1 chart, it appears that a local correction began to take shape. The pair will keep dropping till it reaches the levels of 1741.81 - 1711.41 if this supposition is true. In this case, the level of 1866.32 is crucial since a breakout there would allow the pair to advance further, to levels between 1920.84 and 1950.00.
 |
| XAUUSD : Elliott wave analysis and forecast for 06.01.23 – 13.01.23 |
 |
| XAUUSD : Elliott wave analysis and forecast for 06.01.23 – 13.01.23 |
 |
| XAUUSD : Elliott wave analysis and forecast for 06.01.23 – 13.01.23 |


.png)
.png)